On this page
Elliott wave theory grew out of the view that “the way crowd psychology moves is what forms the patterns and the trends of prices in the market”.
You cannot talk about technical analysis without talking about Dow theory, which is seen as the basic groundwork this school of thought was built on. Alongside it, another theory has a good deal in common with Dow theory but goes deeper into the cycle structure of a price trend, and that is the Elliott wave.
One of the most important things in this theory is working out which stage of the cycle the market is in, or in other words which Elliott wave it is in, and from there estimating what the market may do next and trading accordingly.
This article will help you understand what Elliott wave theory says, the conditions it needs, the Elliott wave patterns and how to measure the size of a price move in forex trading.
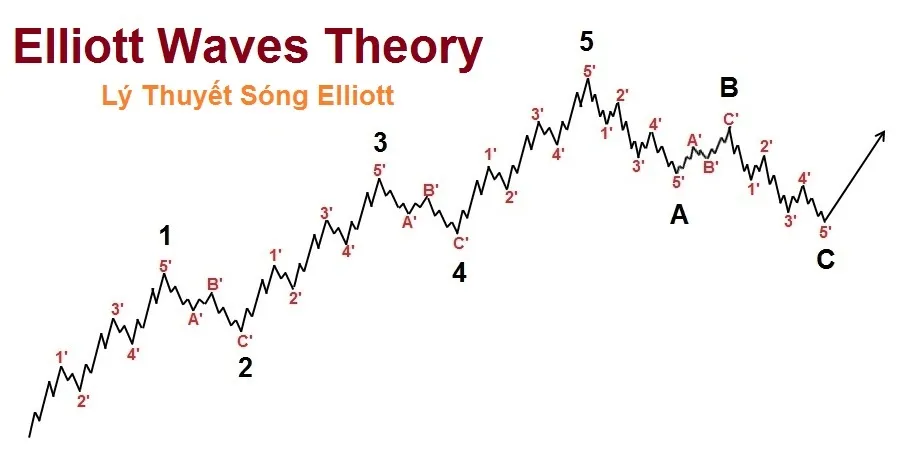
The screenshot shows the Vietnamese interface; the buttons and labels sit in the same places in the English version.
What Elliott wave theory is
Elliott wave theory was developed by a professional accountant and well-known American author, Ralph Nelson Elliott (Jul 28, 1871 – Jan 15, 1948).
This theory grew out of the view that “the way crowd psychology moves is what forms the patterns and the trends of prices in the market”. The psychology and the behavior of the crowd happen naturally, but they usually follow a given cycle, at times excited, at times gloomy, so the result, the movement of price, also follows cycles like that, rising at times and falling at others. These rising and falling cycles are each defined by their own distinct patterns, which the author called waves, and they repeat over and over.
Elliott wave theory is not a technical indicator or a specific trading method; it is a way of reading the structure of a trend. Its big drawback is that counting waves is fairly subjective: on the same chart, two people can count differently, and the count often has to be revised as price carries on. The theory is used widely across many different financial markets, such as stocks, forex, cryptocurrencies and commodities as well; any market driven by the behavior of the crowd can use Elliott wave theory.
The basic structure of an Elliott wave cycle
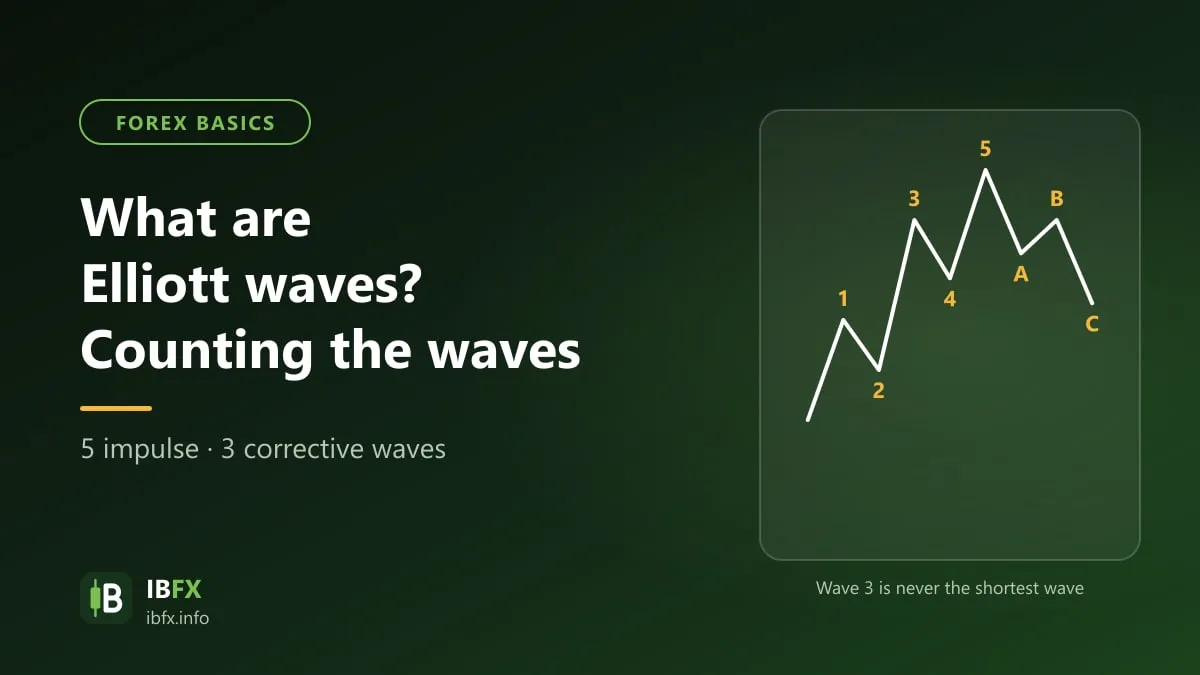
A complete, most basic Elliott wave cycle is made of 8 waves in a 2-phase, 5-3 structure. The first phase has 5 wave legs numbered 1 to 5, and these 5 legs move with the main trend; the second phase has 3 corrective legs moving against the main trend, marked with the letters A, B and C.
The structure of the Elliott wave cycle in an uptrend:
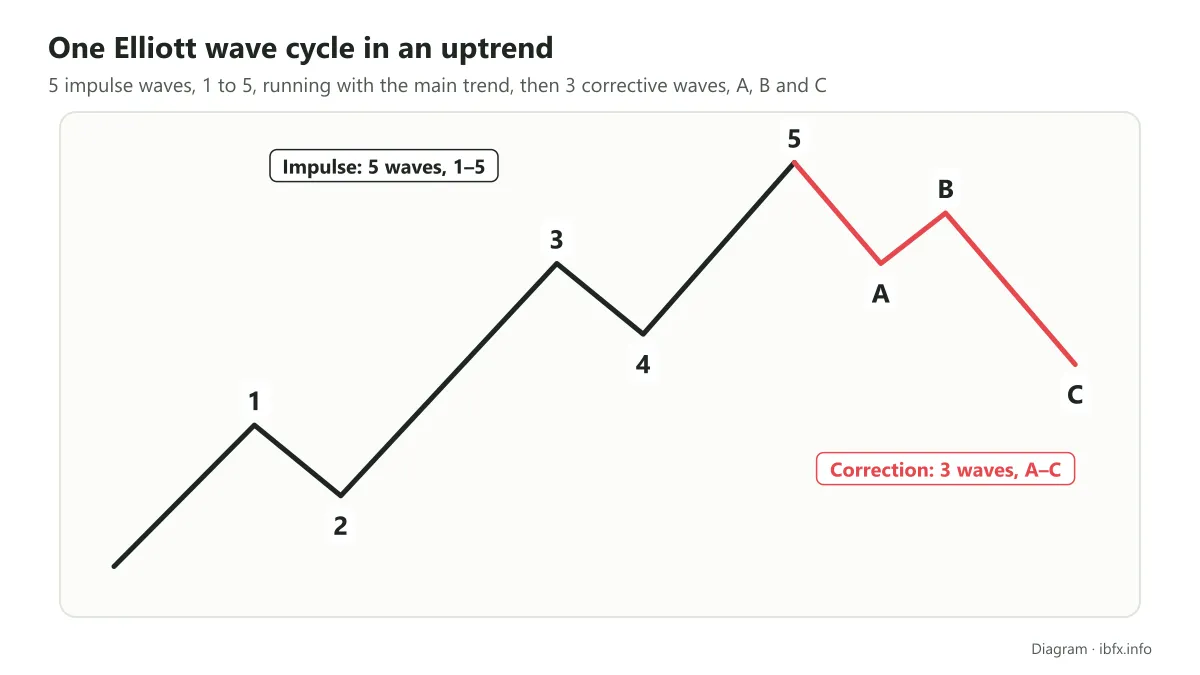
The rising phase is made of 5 waves, 1 to 5, which is called the impulse wave pattern (impulse waves), in which waves 1, 3 and 5 are the rising waves and waves 2 and 4 the falling ones.
The falling phase is made of 3 waves, A, B and C, which is called the corrective wave pattern, in which waves A and C are the 2 falling waves and wave B is a rising one.
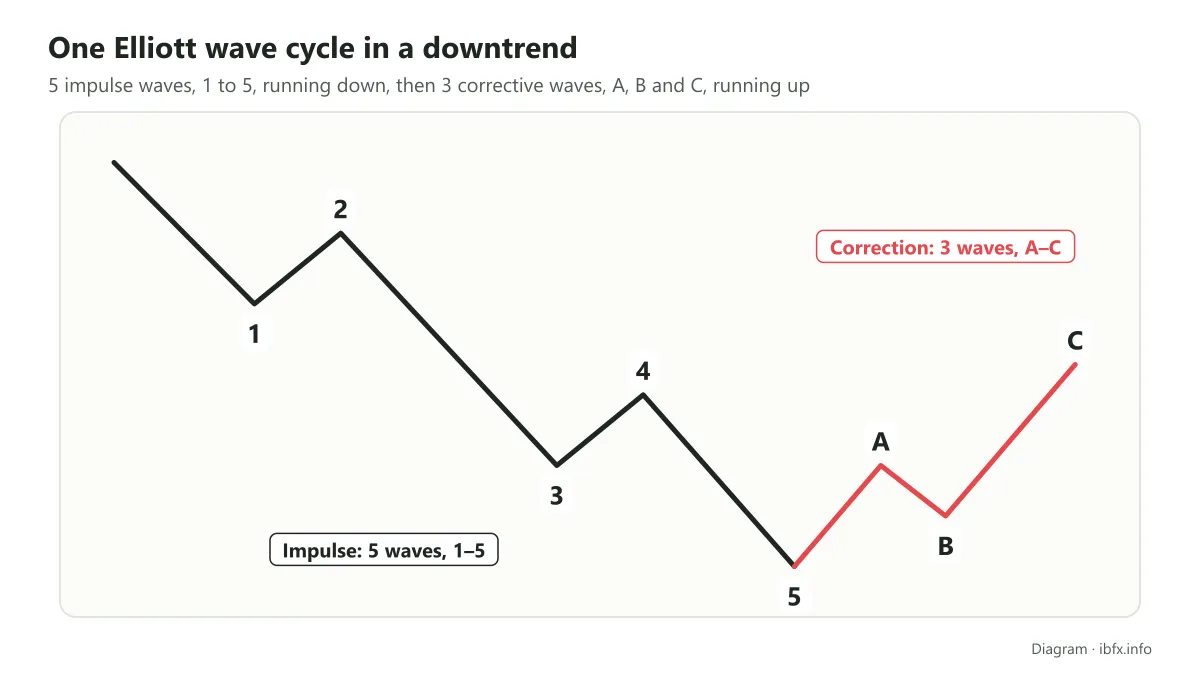
In an uptrend the impulse wave pattern is a rising phase and the corrective wave pattern a falling phase; the other way round in a downtrend, where the impulse wave pattern is a falling phase and the corrective wave pattern a rising one.
- The impulse wave pattern (Impulse Waves)
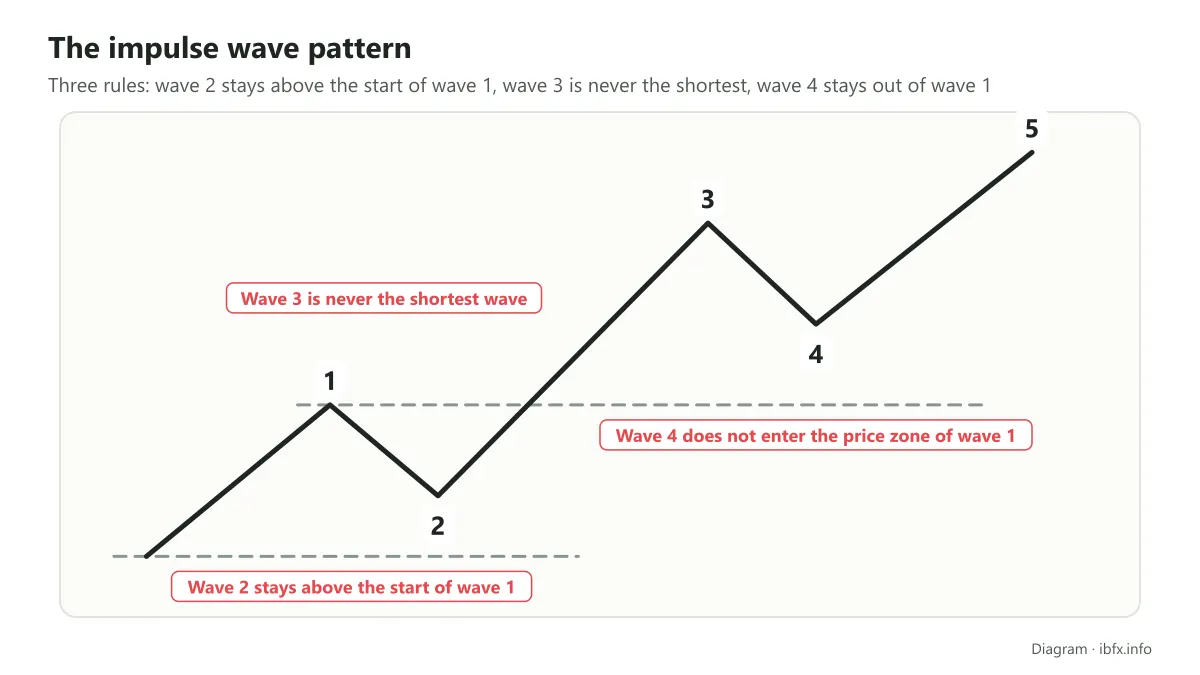
By Elliott wave theory, an impulse wave of the main trend is always made of 5 smaller waves: 3 impulse legs (with the main trend) and 2 corrective legs (against the main trend). To meet the conditions for an impulse wave, though, it has to follow these rules:
- Wave 2 cannot retrace too deeply, which means it must not pass the starting point of wave 1. That keeps the condition of a higher low in an uptrend and a lower high in a downtrend.
- Wave 3 must not be the shortest of the 3 waves 1, 3 and 5.
- Wave 4 does not enter the price zone of wave 1, which means it does not go past the end point of wave 1.
- The corrective wave pattern (Corrective Waves)
A corrective wave of the main trend is usually made of 3 smaller waves; in many cases it can have more than 3 waves, but never more than 5. Of the 3 smaller waves, 2 are corrective (against the main trend) and 1 is an impulse leg (with the main trend).
This corrective wave is usually smaller than the impulse wave in both size and the time it takes to form, but at times it is fairly complicated and hard to identify.
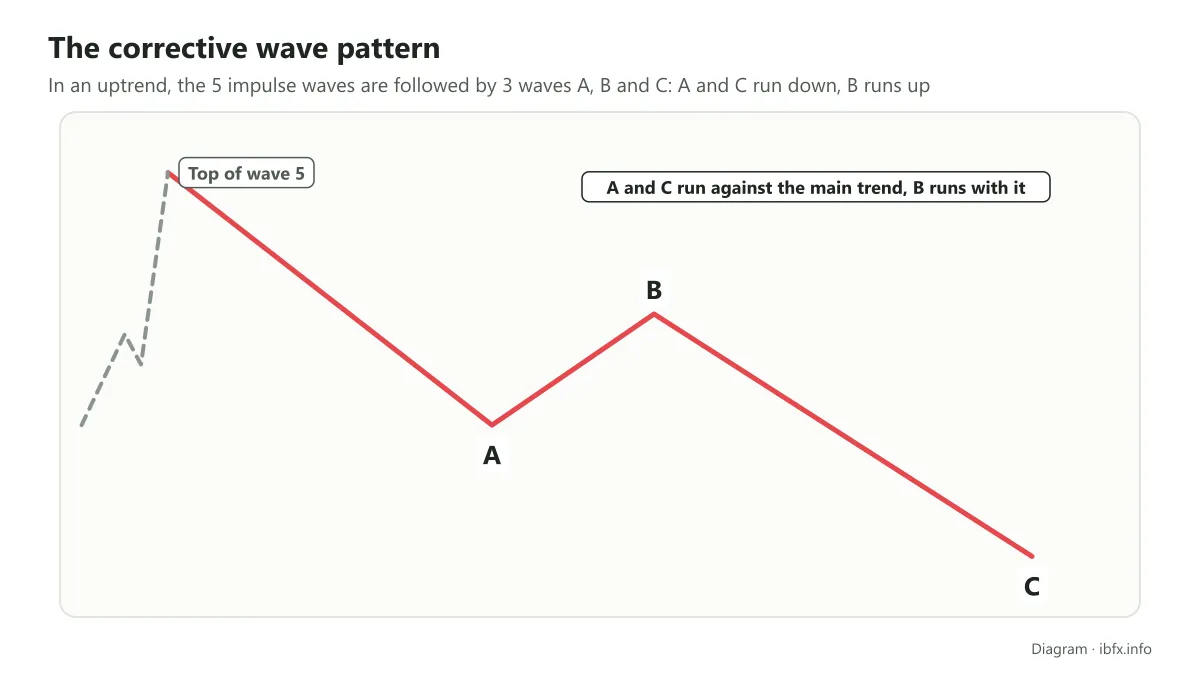
In any financial market, price always moves through rising and falling cycles one after the other, which means that inside a rising main trend the market has falling phases in between, and the other way round. That fits Dow theory exactly, and it now holds for Elliott wave theory too. So the market always falls into 2 opposite stages: the stage where the market confirms the main trend (shown by the impulse waves) and the stage where the market is correcting that main trend (the corrective waves).
The “waves within waves” property of Elliott wave theory
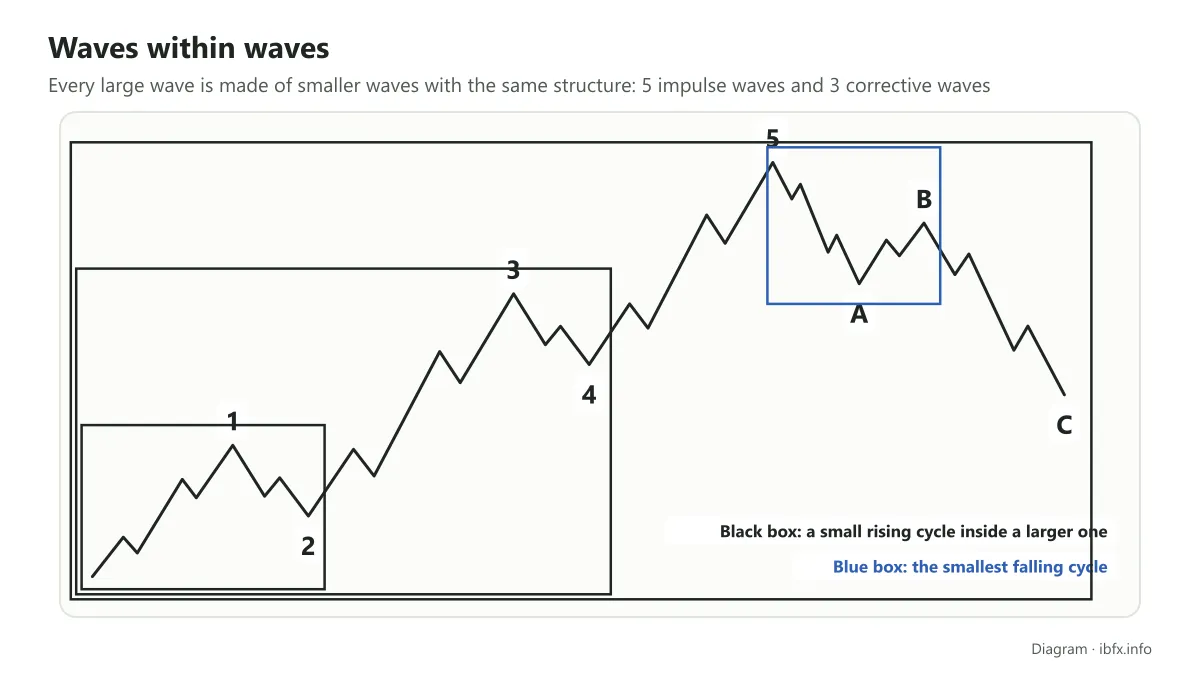
A complete Elliott wave structure is made of one impulse wave and one corrective wave. Each of these Elliott wave structures (level 1) forms a small link inside a larger Elliott wave structure (level 2); each level 2 structure in turn forms a small link inside a still larger one (level 3), and this can repeat up to the nth Elliott wave structure, which is then repeated over and over inside a large trend of the market. How large n is depends on the timeframe and on the length of the stretch of time you look at. This is exactly the waves-within-waves property of Elliott wave theory.
In the picture above, the smallest black box is the smallest rising Elliott wave link, and the larger links match the larger black boxes. In the same way, the smallest blue box is the smallest falling Elliott wave link.
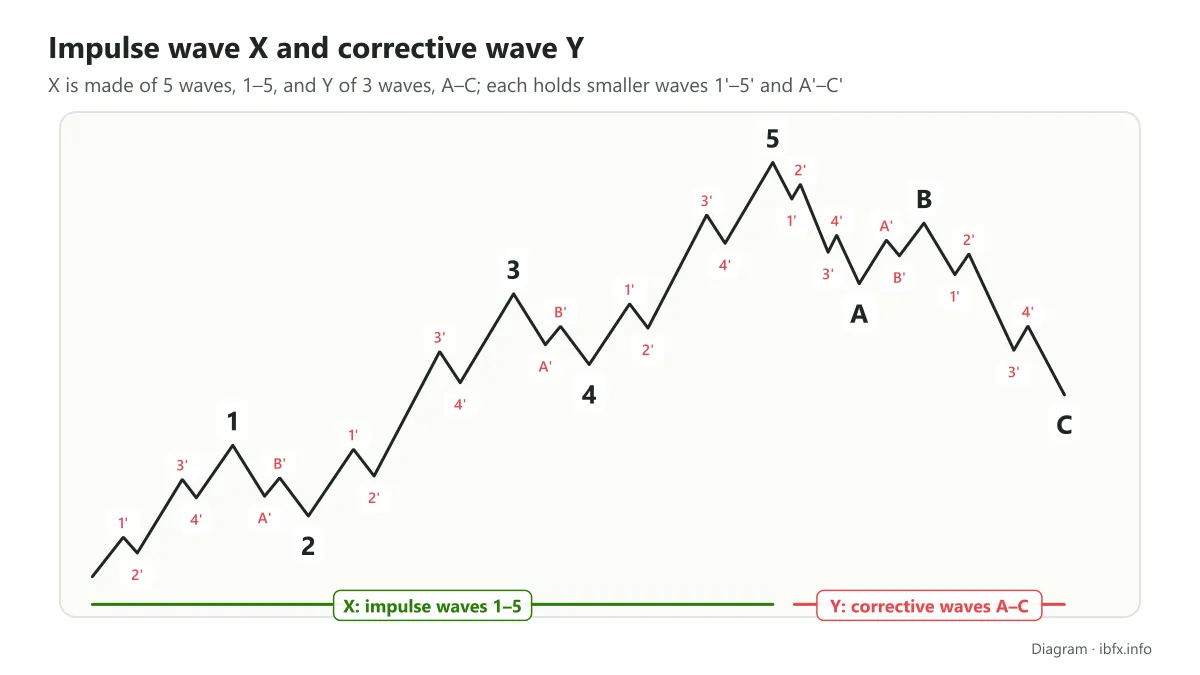
- The largest Elliott wave in the picture above is a wave structure in an uptrend, made of a rising impulse wave (X) of 5 waves 1, 2, 3, 4 and 5, and a falling corrective wave (Y) of 3 waves A, B and C.
- Inside it, impulse wave X is built from 3 smaller Elliott waves, and all 3 of them are wave structures of an uptrend. Each of these smaller waves is made of 1 impulse wave (1’, 2’, 3’, 4’, 5’) running the same way as X and one corrective wave (A’, B’, C’) running the same way as Y.
- Corrective wave Y is built from 2 smaller Elliott waves, and both of them are wave structures of a downtrend. Each of these small Elliott waves is made of 1 impulse wave (1’, 2’, 3’, 4’, 5’) running the same way as Y and one corrective wave (A’, B’, C’) running the same way as X.
- And so on for the smaller links.
The degrees of Elliott wave
In the example above, once that largest Elliott wave is complete, another Elliott wave with a similar, matching structure forms next, and one after another these make up an Elliott wave of a higher degree. Elliott wave theory has 9 different degrees, based on how long each degree takes to complete; all of these divisions are only approximate, though. On top of that, within the same degree the size of each wave and the time it takes to form can also differ a great deal. The 9 Elliott wave degrees are:
- Grand Supercycle: lasts as long as a century
- Super Cycle: lasts several decades
- Cycle: lasts from one year to several years
- Primary: from a few months to 1 or 2 years
- Intermediate: from a few weeks to a few months
- Minor: lasts about a few weeks
- Minute: lasts a few days
- Minuette: lasts a few hours
- Subminuette: only within a few minutes
The advanced wave pattern structures
The Elliott wave structure we have been talking about so far is the most basic one. In practice, impulse and corrective waves have far more complicated structures. Ralph Nelson Elliott also set out the different wave patterns, and he named and described these structures in great detail.
Each impulse wave has 5 smaller waves and each basic corrective wave 3 smaller waves, 8 smaller waves in total. Each of those smaller waves differs in how many sub-waves it is built from and in the exact shape of each leg. So the total number of Elliott wave patterns is a very large number. Within this article, then, we will only show you the most common and the most typical Elliott wave patterns.
The patterns of the impulse waves
- Extension (the extended wave pattern)
- Diagonal Triangle
- Leading Diagonal Triangle
- Ending Diagonal Triangle
- Failed 5th, or Truncated 5th (the truncated fifth wave pattern)
The extended wave pattern (Extension)
Each of waves 1, 3 and 5 can extend into a structure with more waves inside it (usually 5 waves), and can extend several times over. In this Extension pattern only one wave extends, usually wave 3, although there are cases where wave 1 or wave 5 extends. If wave 3 extends, waves 1 and 5 follow the basic structure and tend to balance each other.
An extended wave has the structure of a basic impulse wave.
If wave 3 extends once, the impulse wave has 9 waves in total; extending twice gives 13, and extending 3 times gives 17.
The pattern where wave 3 extends once has the wave structure 5-3-5-3-5-3-5-3-5
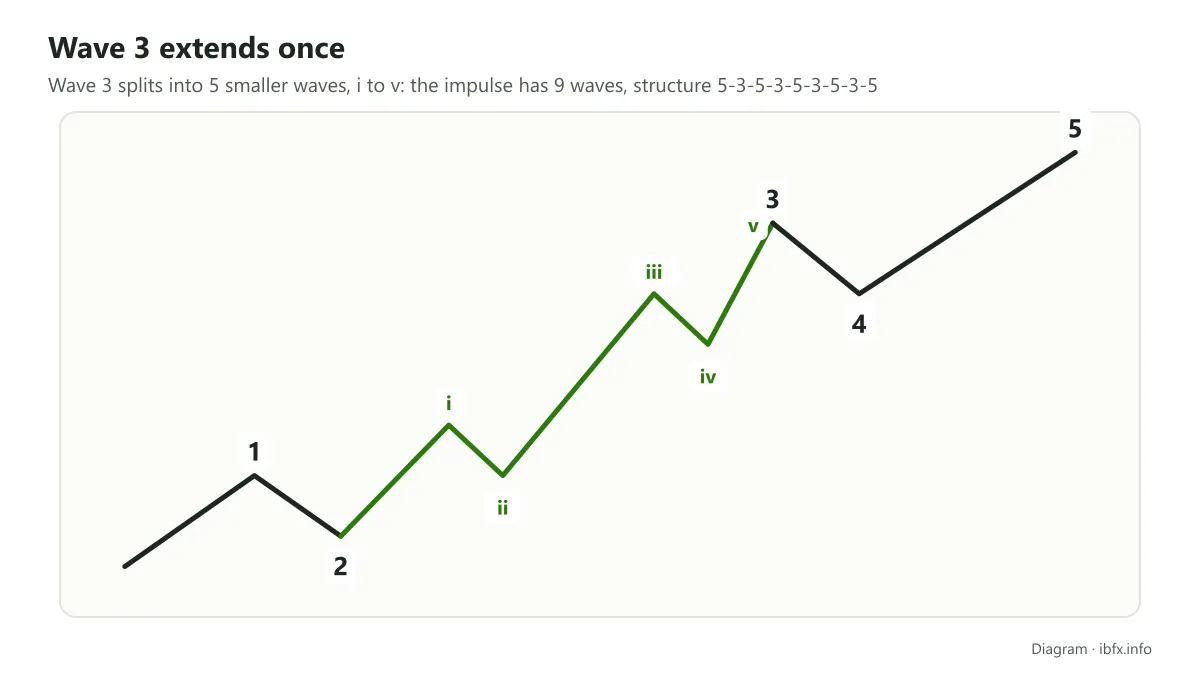
Wave 3 extends into 5 smaller waves; if it extends twice, one of these 5 smaller waves extends into 5 still smaller waves.
The pattern where wave 3 extends twice, with wave i as the extending wave: the wave structure 5-3-5-3-5-3-5-3-5-3-5-3-5
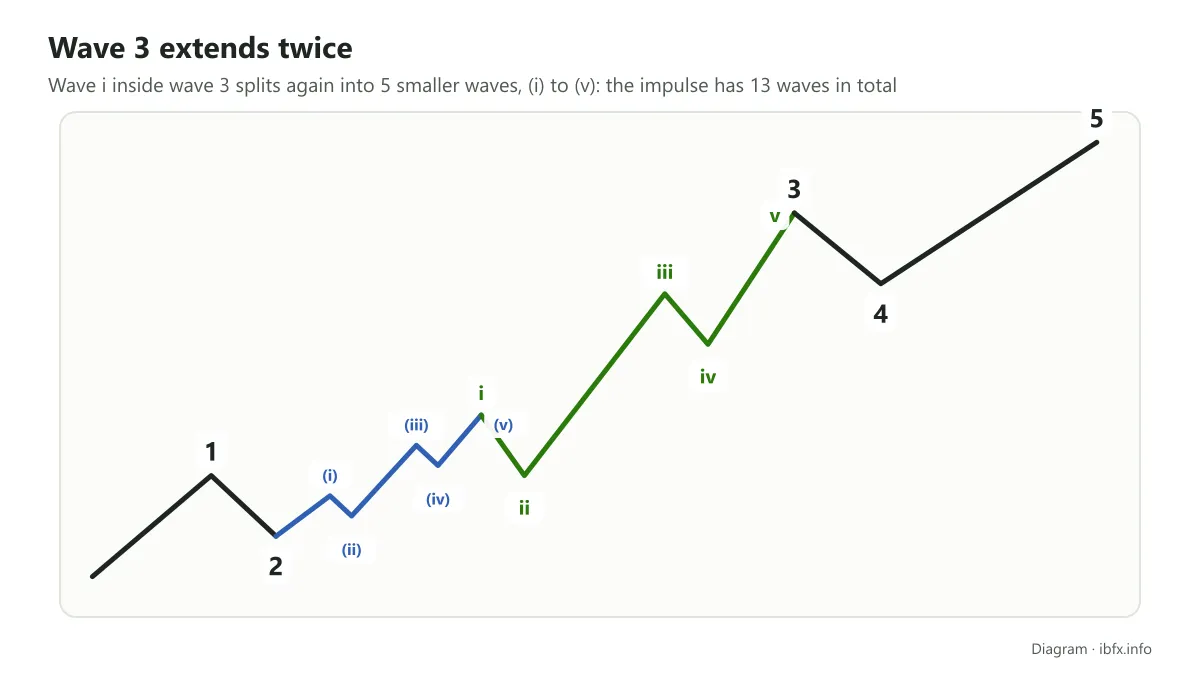
The extended wave usually shows up in waves 1, 3 and 5 of the impulse wave and in waves A and C of the corrective wave.
The diagonal triangle pattern (Diagonal Triangle)
What makes this pattern special is that when you draw the trendlines through the highs and the lows of the wave legs, they form a triangle.
This pattern splits into 2 different kinds, based on the wave structure:
A Leading Diagonal Triangle has the wave structure 5-3-5-3-5, and an Ending Diagonal Triangle has the wave structure 3-3-3-3-3
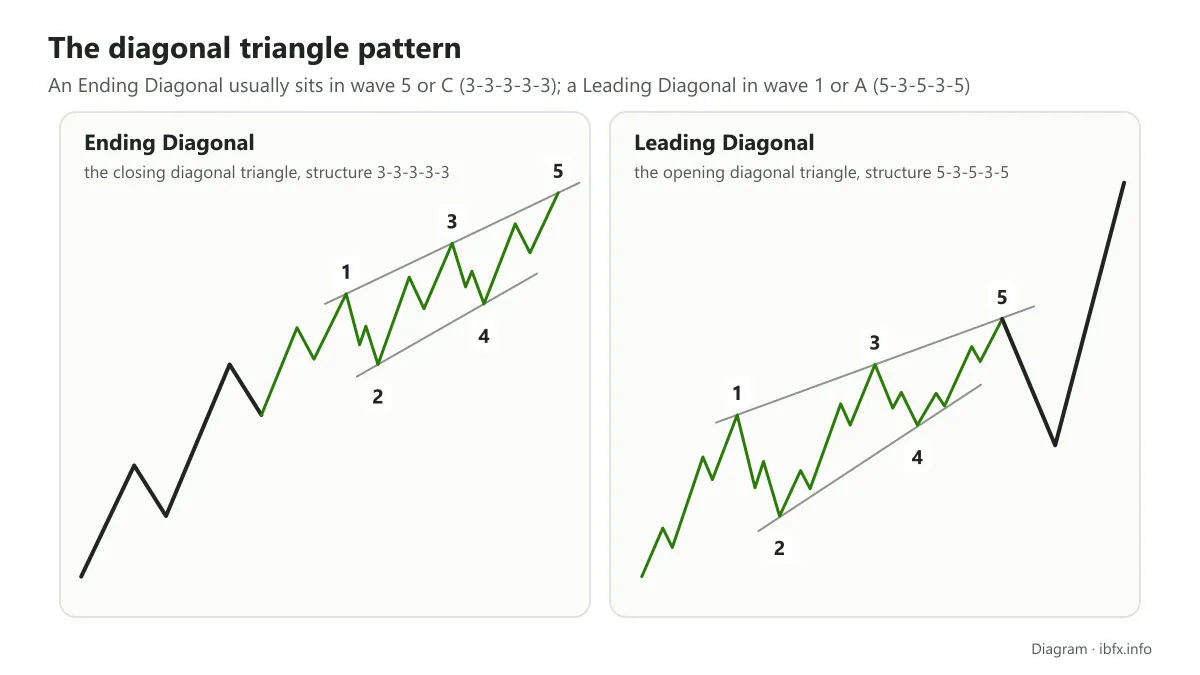
In which:
- With an Ending Diagonal, waves 1, 3 and 5 take the Zigzag shape (described in detail further on)
- Waves 2 and 4 can follow any corrective pattern
- Wave 3 cannot be the shortest wave
Note: the triangle in this pattern usually contracts, and at times expands (diverges). What is special about it is that in the diagonal triangle pattern wave 4 usually does enter the price zone of wave 1; this is the exception to the rule that “wave 4 does not enter the price zone of wave 1”.
The Leading Diagonal Triangle usually shows up in wave 1 and wave A. The Ending Diagonal Triangle usually shows up in wave 5 and wave C.
The failed fifth wave pattern (Failed 5th), or the truncated fifth wave pattern (Truncated 5th)
This is an impulse wave pattern in which wave 5 cannot clear wave 3. In some cases wave 5 does clear it but only barely, and that still counts as this pattern.
All the other waves follow the structure of a basic impulse wave.
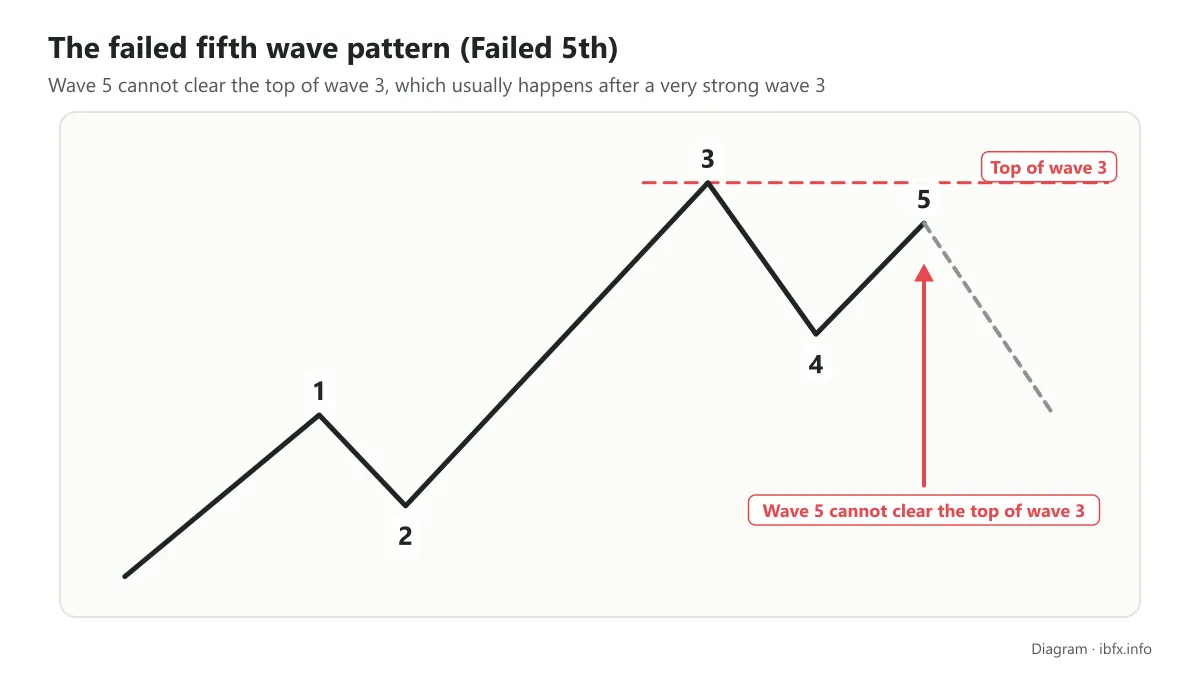
The failed fifth wave pattern usually shows up after a very strong wave 3, at wave 5 of the impulse wave or inside wave C.
The patterns of the corrective waves
- Zigzag
- Flat (the flat pattern)
- Triangle
The Zigzag pattern
The easiest way to spot a Zigzag pattern by eye is that the 2 trendlines running through the highs and the lows are parallel to each other. The structure of the Zigzag pattern is 5-3-5.
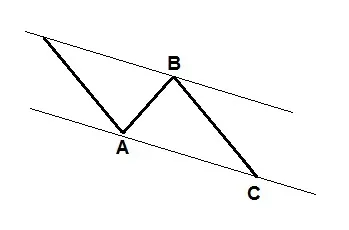
In which:
- Wave B usually retraces no more than 61.8% of the length of wave A
- Wave C almost always goes past the end point of wave A
- Waves A and C are usually about the same length
The Zigzag pattern can extend itself into a Double Zigzag or a Triple Zigzag. In these variants the single Zigzag patterns are joined by any corrective wave pattern, called wave X. Wave X is usually shorter than the single Zigzag waves.
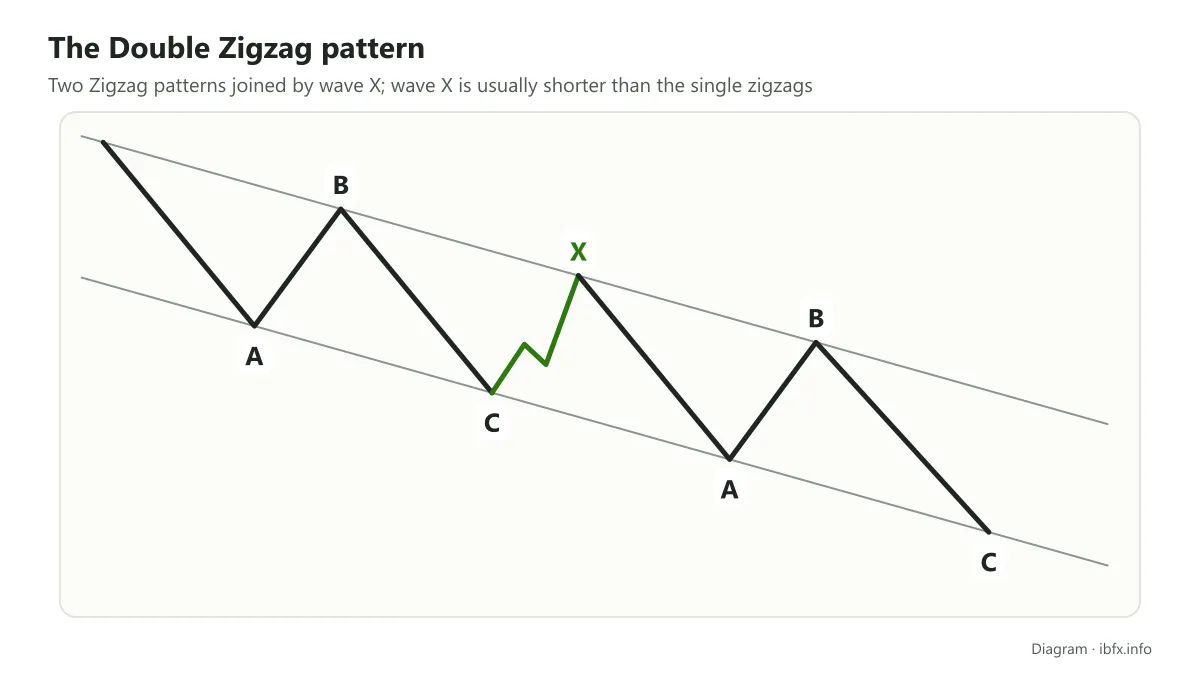
In the Triple Zigzag pattern, the 3 single Zigzag waves are joined by 2 X waves, both of them corrective wave patterns.
This Zigzag pattern is often found in wave 2, wave A, wave B or wave X.
The flat pattern (Flat)
Here too the 2 trendlines joining the highs and the lows are parallel, but in the Flat pattern these 2 trendlines run sideways instead of sloping up or down as they do in the Zigzag pattern.
The structure of the Flat pattern is also very different from the Zigzag: 3-3-5
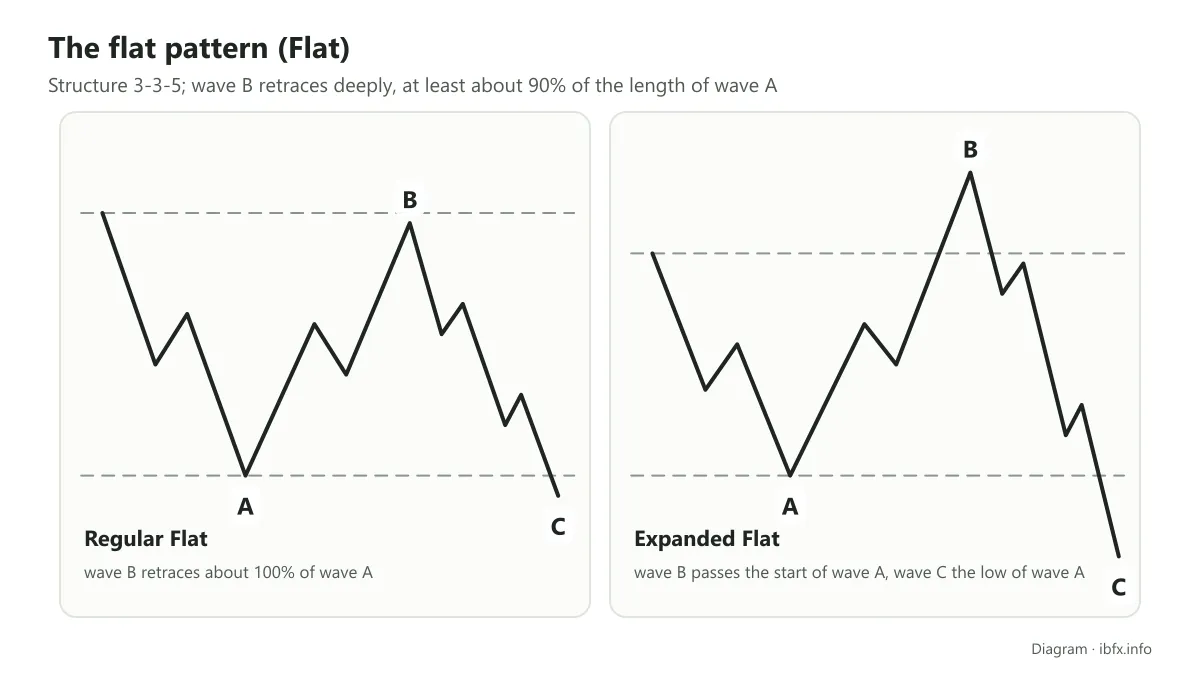
In which:
- Waves A and B are corrective wave patterns
- Wave C has the structure of an impulse wave
- Wave B retraces deeply, at least about 90% of the length of wave A, usually back near the starting point of wave A (a 100% retracement) or past the starting point of wave A (a retracement of more than 100%, called an expanded Flat)
- With a regular Flat (wave B retracing about 100%), wave C is usually about as long as wave A and ends around the end point of wave A, and may go slightly past it. With an expanded Flat (B going past the starting point of wave A), wave C is usually longer than wave A and moves outside the price zone of wave A.
This flat pattern mostly shows up in waves 2, 4 and B, and at times in wave X.
The triangle wave pattern (Triangle)
This is a special corrective wave pattern made of 5 waves, each with 3 smaller waves, so its structure is 3-3-3-3-3. The two trendlines joining the highs and the lows cross to form a triangle that either contracts or expands (diverges).
The contracting triangle
The contracting triangle pattern splits into 3 different kinds: the ascending triangle, the descending triangle and the symmetrical triangle
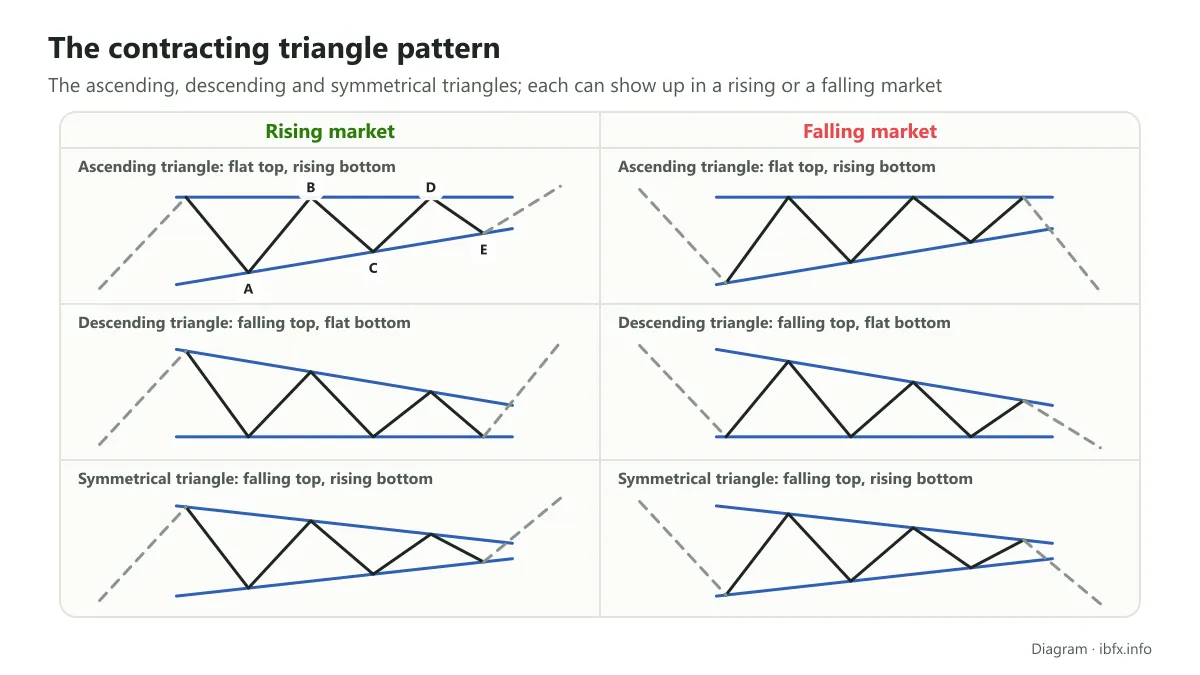
In which:
- There are 5 waves, A, B, C, D and E, and each wave is any corrective wave pattern
- The five waves are built on a 3-3-3-3-3 structure, meaning every one of them is itself a corrective pattern
- Wave D cannot move outside the price zone of wave C
- Wave A is the longest wave and wave E the shortest
The expanding (diverging) triangle
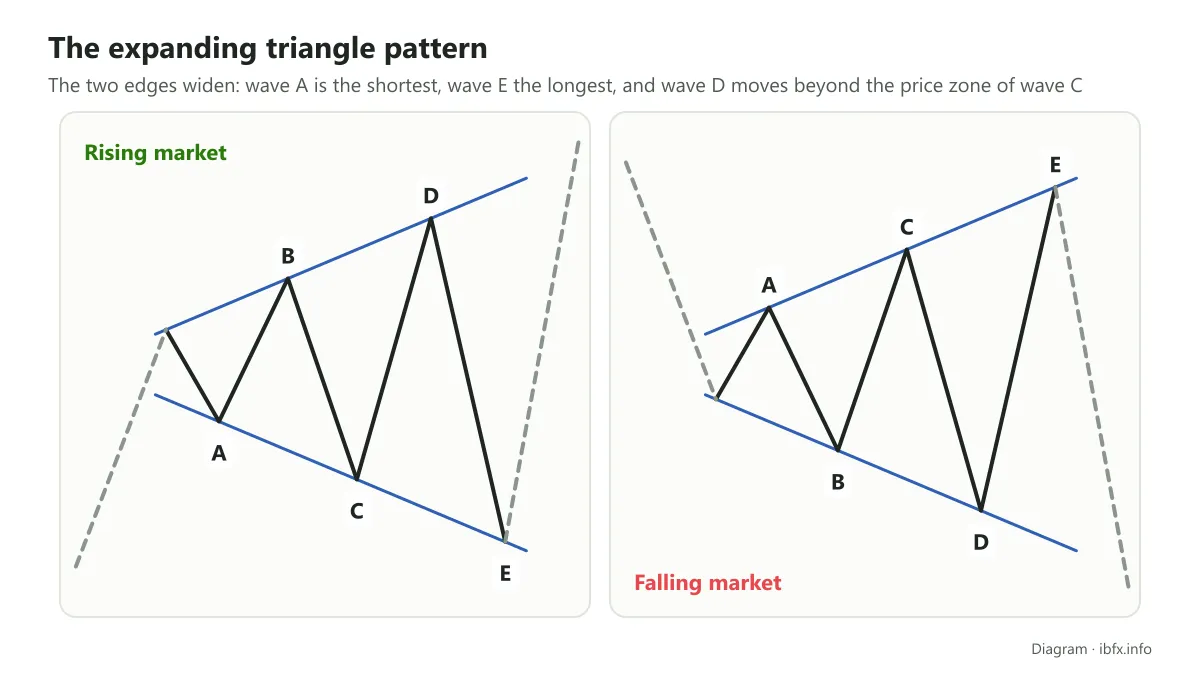
In which:
- There are 5 waves, A, B, C, D and E, and each wave is any corrective wave pattern
- The five waves are built on a 3-3-3-3-3 structure, meaning every one of them is itself a corrective pattern
- Wave D moves outside the price zone of wave C
- Wave A is the shortest wave and wave E the longest
The triangle corrective wave pattern shows up almost only in waves 4, B and X, and almost never in wave 2.
The tools for setting price targets and wave size
The 2 tools used most widely to estimate price targets are the price channel and Fibonacci. These targets are only reference zones, not price points that price is certain to reach.
The price channel
A price channel is made of 2 trendlines parallel to each other, holding almost the whole swing range of price inside one wave. In the triangle wave patterns these 2 trendlines are not parallel, but in that situation we still treat them as a price channel.
This price channel tool is usually used to spot waves of the same degree, and it works well in the basic impulse wave patterns, the Zigzag pattern and the triangle wave patterns.
Example:
The price channel of the basic impulse wave pattern, and of a corrective wave whose sub-waves are Zigzag patterns
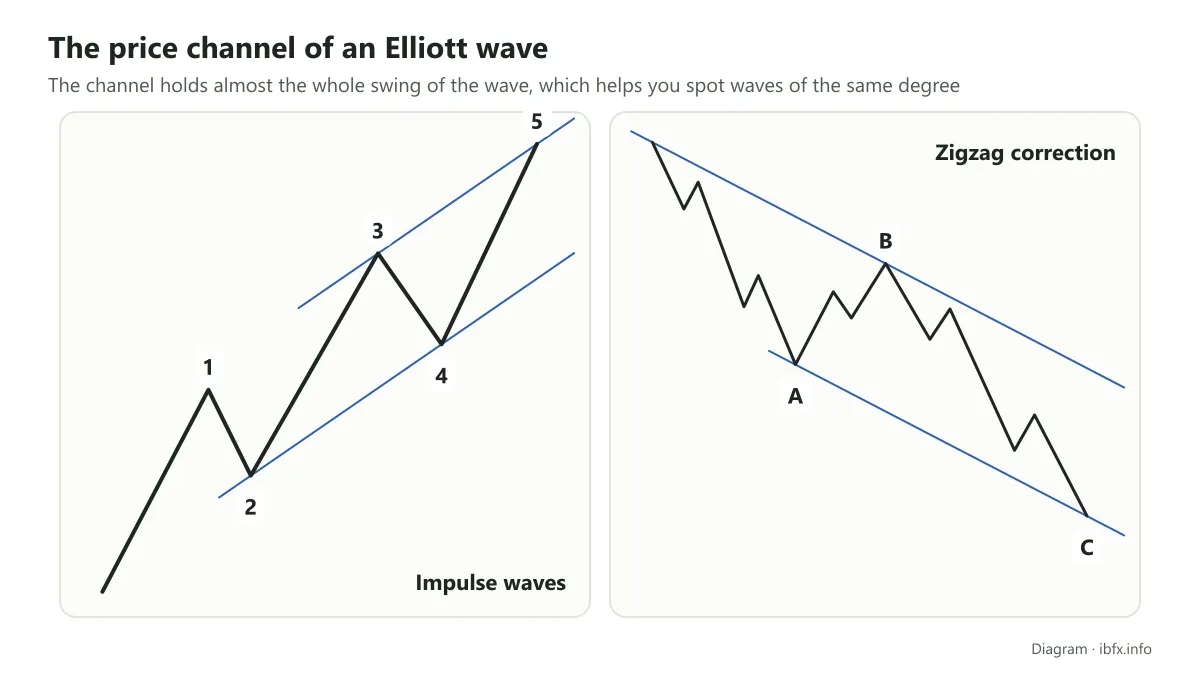
Using a price channel to target wave 3 and wave C
One of the rules when you set a price target and a wave size from a price channel is that the market has to have formed at least 2 waves.
Once waves 1 and 2, or A and B, have formed, you draw the price channel for the impulse wave or for the corrective wave.
- Impulse wave: the lower trendline is drawn first, running through the starting point of wave 1 and the end point of wave 2. The upper trendline comes after, running through the end point of wave 1 and parallel to the lower trendline.
- Corrective wave: the upper trendline is drawn first, running through the starting point of wave A and the end point of wave B. The lower trendline comes after, running through the end point of wave A and parallel to the upper trendline.
The price target of wave 3 and of wave C has to be at least on those trendlines.
Wave 3, though, is usually longer than wave 1 and is usually the longest wave in the impulse wave pattern, so it usually reaches or moves outside the price channel; if it does not, you should weigh up the chance that it is wave C of a corrective pattern rather than an impulse wave.
For wave C inside a corrective wave, the price target may reach the price channel, move past it or fall short of it, and any of those is fine.
If waves 2 and B move outside the price channel, they may not be complete and may be moving in a more complicated structure, so waves 3 and C cannot be identified yet. At that point you need another tool to set the target for wave 3 and wave C.
Using a price channel to target wave 4
Once wave 3 has formed, we have to redraw a new price channel, and this channel may not match the first one drawn when waves 1 and 2 formed, as in the case above.
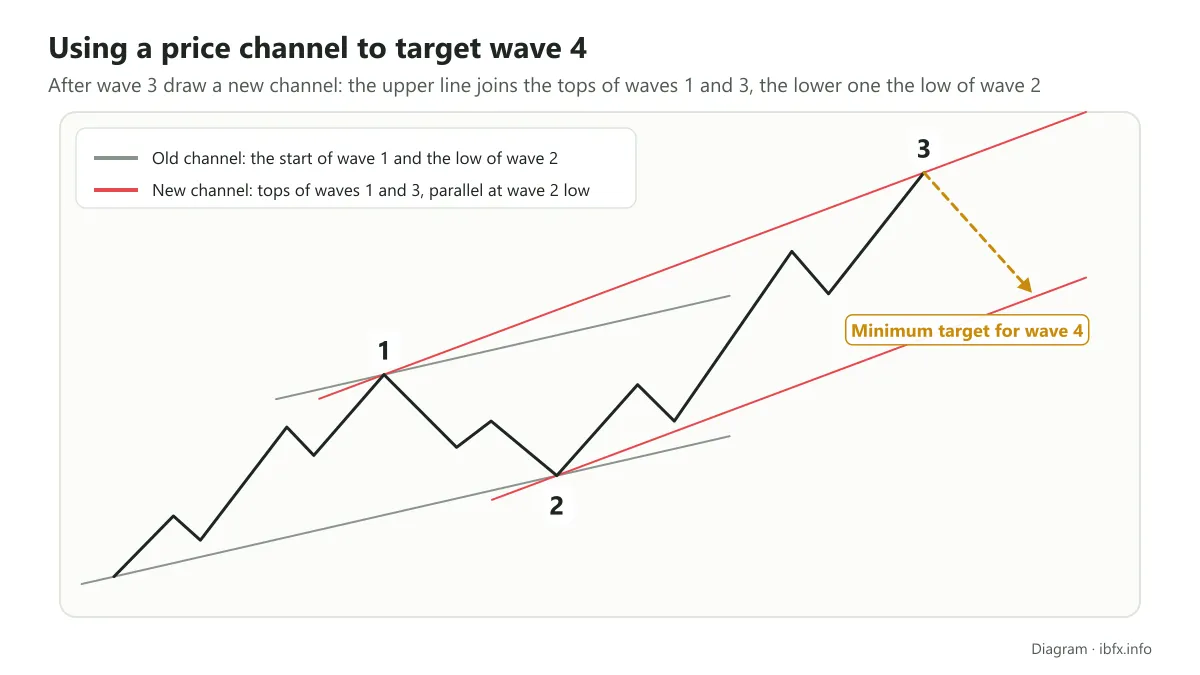
The new price channel is drawn like this: the upper trendline first, running through the end point of wave 1 and the end point of wave 3. The lower trendline after, running through the end point of wave 2 and parallel to the upper trendline.
The minimum price target of wave 4 has to be on the price channel; wave 4 may move outside the channel and break the lower trendline. If wave 4 enters the price zone of wave 1, it can only be the diagonal triangle pattern; if it is not a diagonal triangle, the wave count is wrong and has to be counted again.
If wave 4 cannot reach the price channel, it means this uptrend is very strong, and 2 things are possible: either wave 3 is not complete and is going on in a more complicated structure, or this really is wave 4 with a very small downward correction, and the market may break out at wave 5.
Using a price channel to target wave 5
In the same way, once wave 4 is complete, we draw another new price channel to find the target for wave 5.
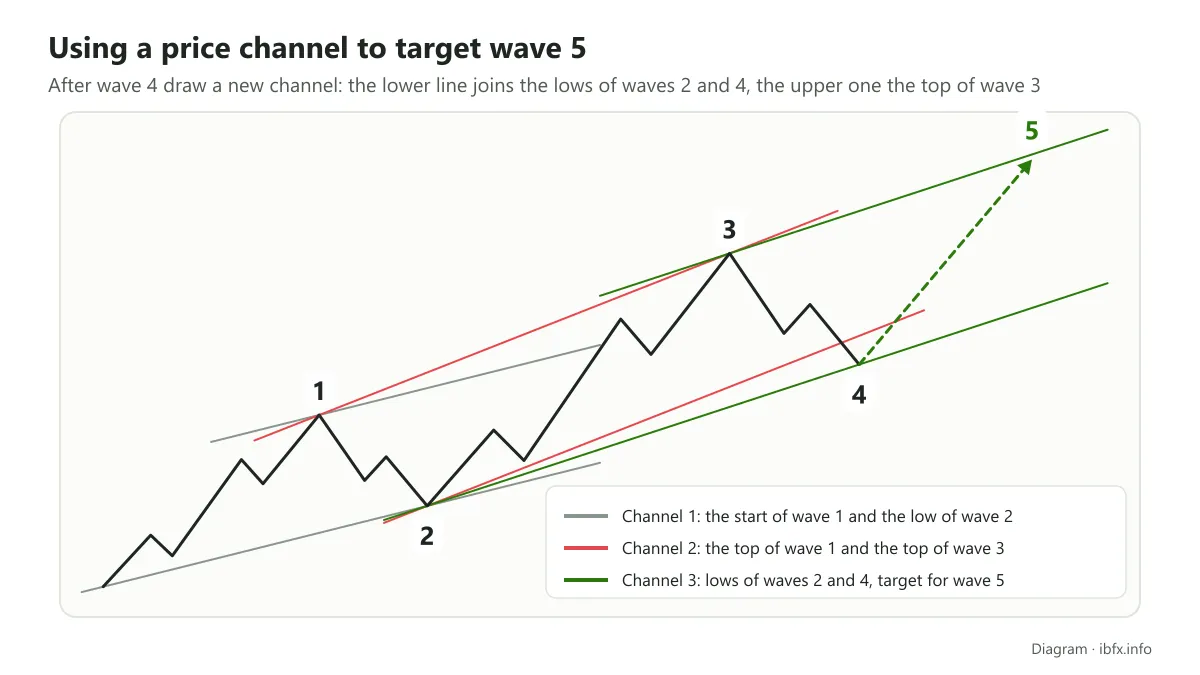
The new price channel is set up like this: the lower trendline is drawn first, running through the end point of wave 2 and the end point of wave 4. The upper trendline after, running through the end point of wave 3 and parallel to the lower trendline.
The price target of wave 5 will at least reach the upper trendline. If wave 3 rose weakly, wave 5 will push up very strongly; and if wave 5 extends, it can move outside the range of the price channel. The other way round: if wave 3 was a strong, fairly long rising wave, wave 5 will be a short wave and may not reach the price channel.
Fibonacci
Studying the mathematical properties of waves and wave patterns, Ralph Nelson Elliott came to a conclusion about the relationship between Fibonacci and the Elliott wave: that the Fibonacci sequence is the basis of Elliott wave theory. The important Fibonacci retracement levels show up again and again in the Elliott wave structure, in both the basic impulse and corrective wave patterns and in all their more complicated variants.
Learn more:
To work out the size of a wave, the market has to have formed at least the first wave, which is wave 1 of the impulse waves or wave A of the corrective waves.
Wave 1 and wave A are the base waves; their length and their slope decide the size of the waves that follow when you use Fibonacci.
In the trading platform, we use the Fibonacci Extension to set the size of the impulse waves (3 and 5), and the Fibonacci Retracement for the corrective waves (2 and 4).
Wave 2
By the rules of Elliott wave theory, wave 2 must not go past the starting point of wave 1. The retracement of wave 2 against wave 1 is usually somewhere above 30%, matching the important Fibonacci levels such as 38.2%, 50%, 61.8% or 76.4%.
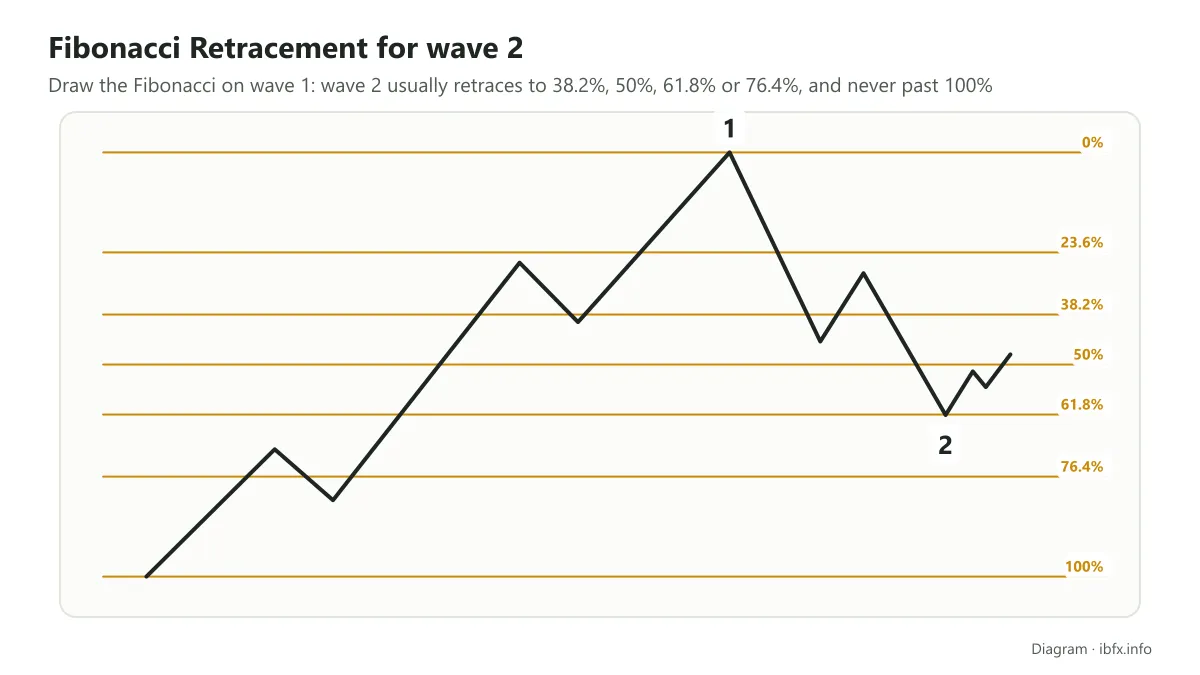
To set the size of wave 2, use the Fibonacci Retracement on the rising leg that is wave 1.
Wave 3
Wave 3 is not the shortest wave and is usually the longest of waves 1, 3 and 5. Because of that, wave 3 is more likely to reach the higher important Fibonacci levels such as 123.6% or 161.8%. If wave 3 extends, it can rise as far as 261.8%, or even 423.6% of wave 1.
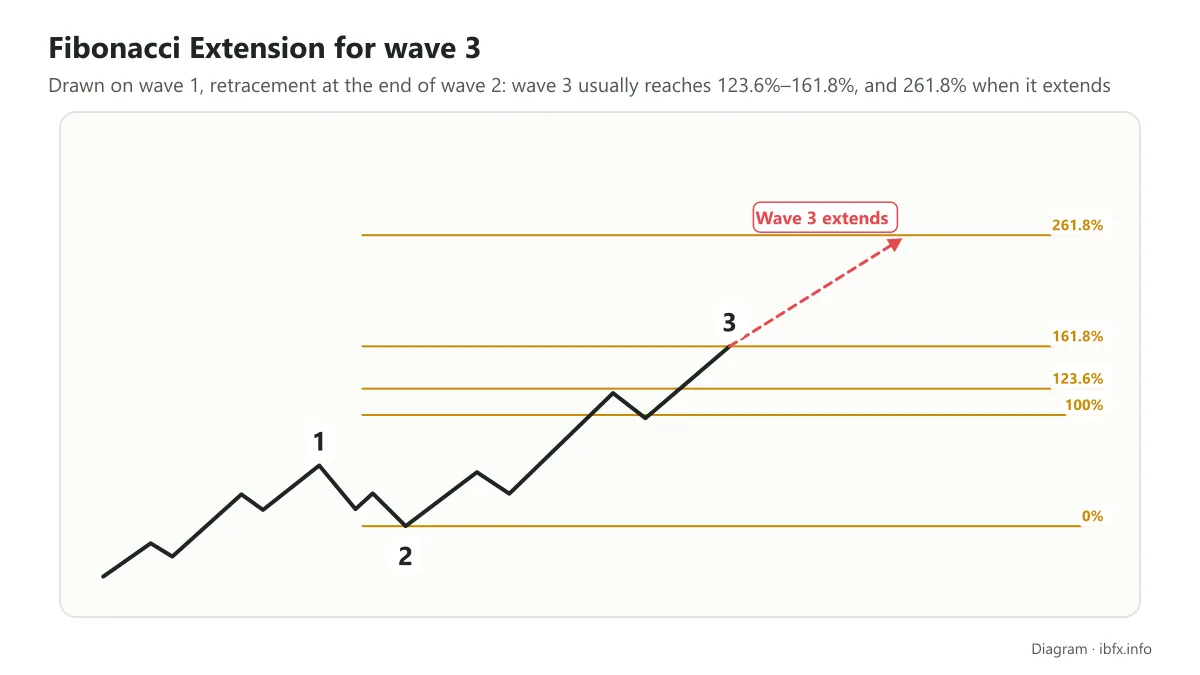
To set the size of wave 3, use the Fibonacci Extension on the rising leg that is wave 1, with the retracement point at the end point of wave 2.
Wave 4
Wave 4 is the corrective wave after wave 3 has formed, so the length of wave 3 is the basis for setting the size of wave 4.
Wave 4 usually retraces about 23.6% to 38.2% of wave 3, rarely deeper, because by the rules wave 4 must not enter the price zone of wave 1. When wave 3 extends, wave 4 usually only retraces around the 23.6% level.
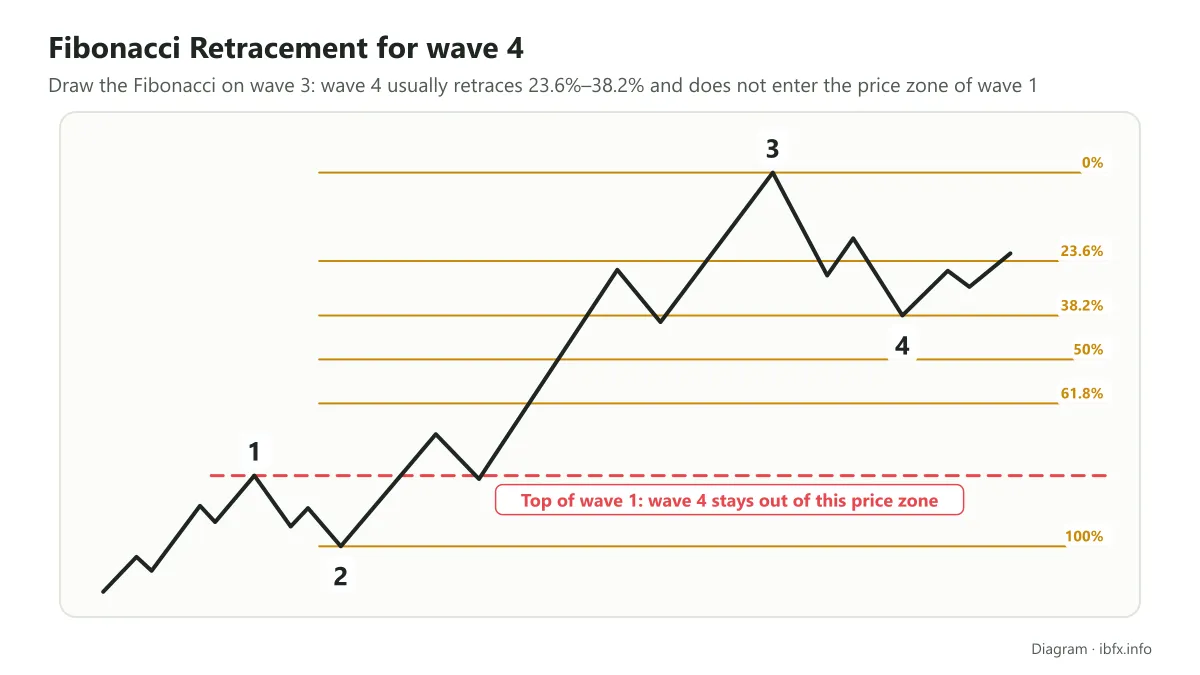
To set the size of wave 4, use the Fibonacci Retracement on the rising leg that is wave 3.
Wave 5
There are 3 cases to watch for when you set the size of wave 5.
If wave 3 is a short wave, only about 123.6% of wave 1 and less than 161.8% of wave 1, then wave 5 will be an extended wave. Its size can be set in several different ways:
- 161.8%, or even 261.8%, of wave 3.
- 61.8%, or 100%, or 161.8% of the total length of waves 1 and 3, measured as the distance from the starting point of wave 1 to the end point of wave 3.
- It can even be 161.8% of the total length of waves 1 and 3, plus the distance from the end point of wave 3 to the end point of wave 4, depending on the particular extension pattern of wave 5.
If wave 3 is a very long wave, or wave 3 extends, the size of wave 5 gets shorter; most commonly wave 5 equals wave 1 or swings between 123.6% and 161.8% of wave 1.
Example: the case where wave 3 is short and wave 5 extends.
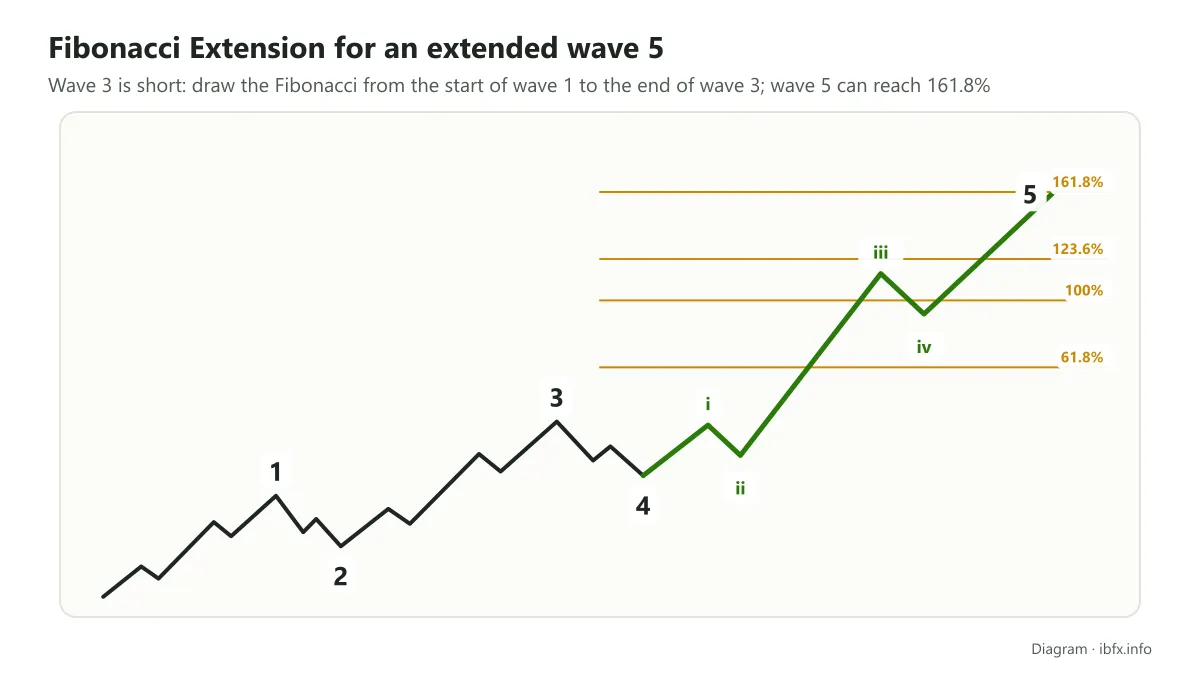
In the case above, we can use the Fibonacci Extension on the rising leg from the starting point of wave 1 to the end point of wave 3, with the retracement point at the end point of wave 4.
The 3rd case is the most special one: wave 5 has the same size as wave 3, and the end point of wave 5 equals the end point of wave 3 or is only barely higher, which means the impulse wave now takes the failed 5th shape.
Wave B
In the Zigzag pattern, wave B usually retraces so that it does not move outside the price zone of wave A, and it is usually 38.2%, 50% or 61.8% of wave A.
In the Flat pattern, wave B equals wave A or moves a short way outside the price range of wave A, usually 123.6% or 138.2% of wave A.
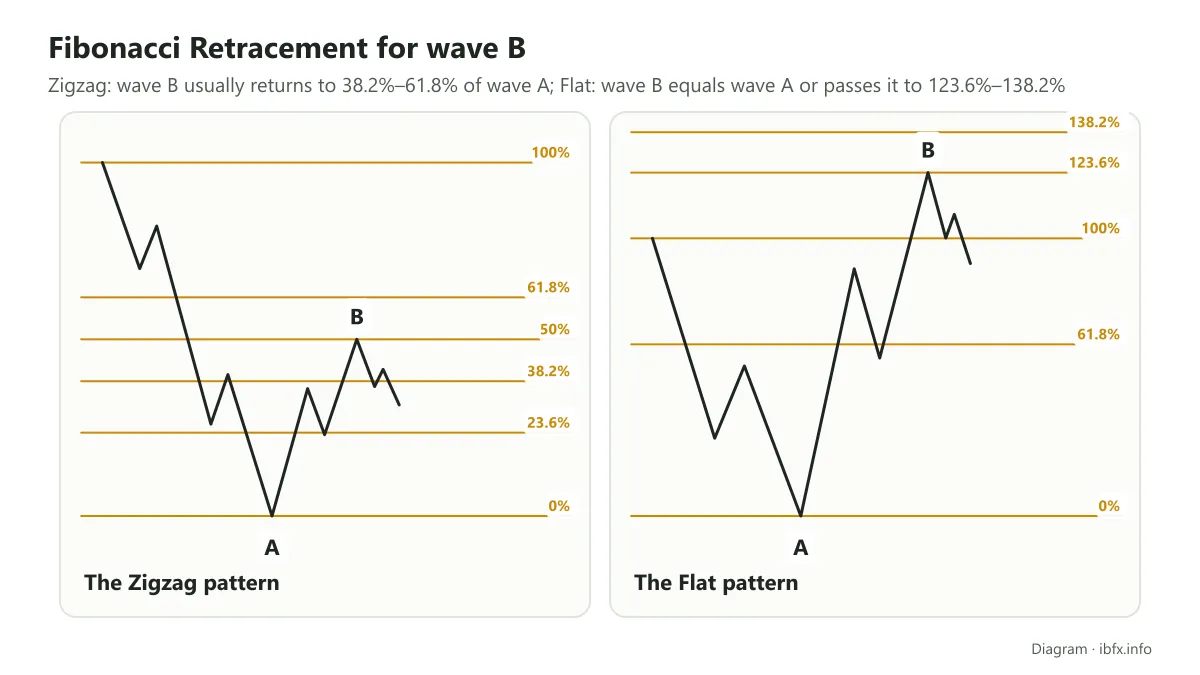
To set the price range in this case, use the Fibonacci Retracement on the falling leg that is wave A.
Wave C
In the Zigzag pattern, the length of wave C is usually at least 61.8% of wave A. When the 2 waves are the same length, wave C runs back to the 100% Fibonacci level.
In the Flat pattern, wave C runs back to the end point of wave A, that is 100% of wave A, when wave B does not move outside the price zone of wave A; or wave C is 123.6% to 161.8% of wave A when wave B does move outside the price zone of wave A.
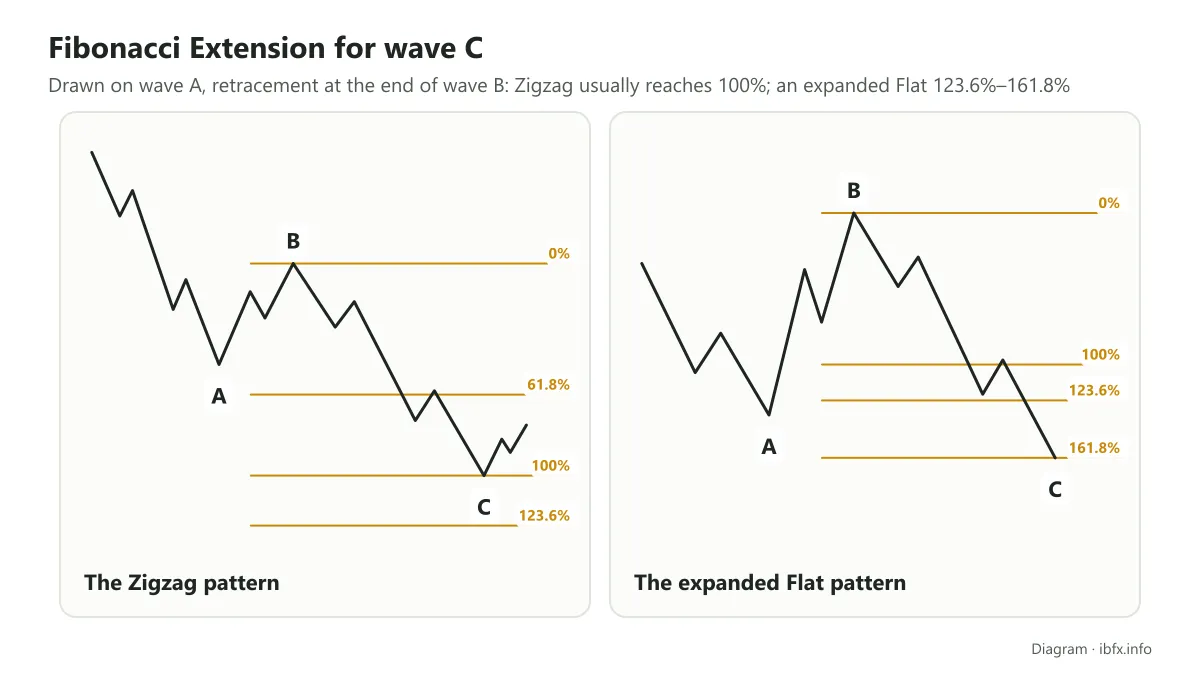
The tool used in this case is the Fibonacci Extension on the falling leg that is wave A, with the retracement point at the end point of wave B.
All the examples in the sections above apply to the Elliott wave structure where the main trend is up. For a downtrend, you simply do the opposite.
Summary
Elliott wave theory is not a trading technique, so it has no specific rules for finding entries or exits. On top of that, predicting exactly what structure an Elliott wave will take is very hard, because it has so many different variants. Even so, many traders still use Elliott wave theory together with other analysis tools, Fibonacci above all, to build price scenarios and estimate how far price may swing.
One useful practical application is to use the 3 rules of the impulse wave to place the stop loss: for example, if you buy at the end of wave 2 expecting wave 3 to rise, the starting point of wave 1 is the level where, if price breaks through it, your wave count is wrong. Always have a stop loss like that, because a wave count goes wrong very easily.