On this page
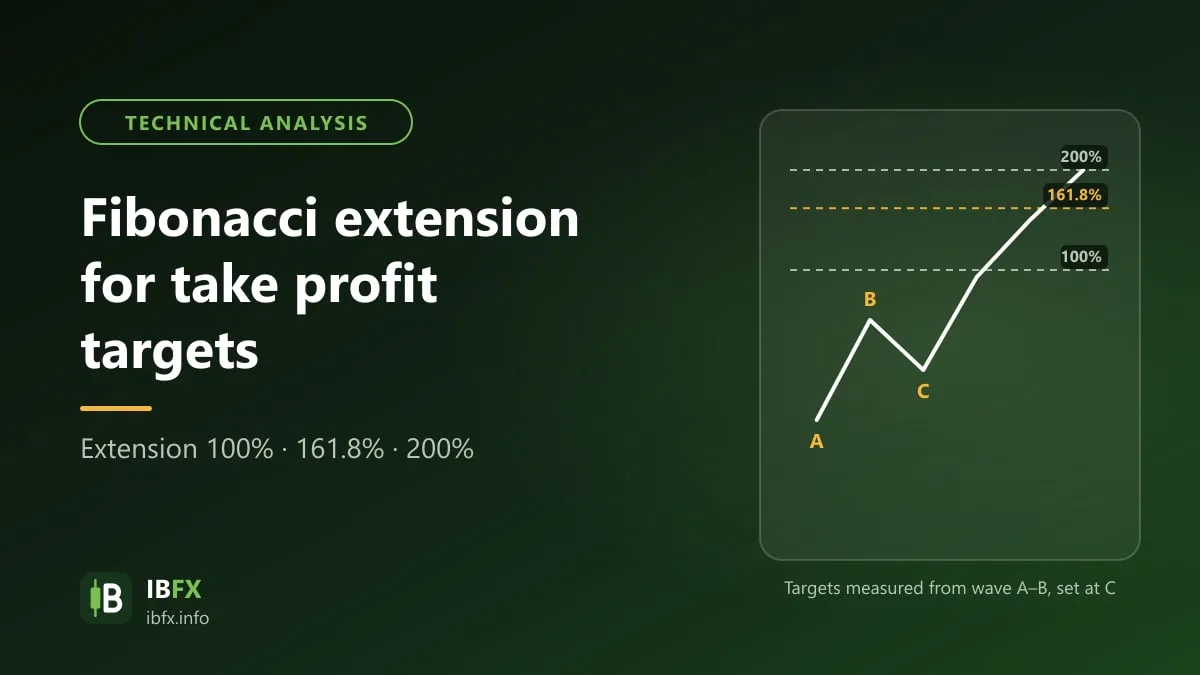
Carrying on our series of articles about Fibonacci, in this article we want to introduce you to a form of Fibonacci that a great many traders are fond of: the Fibonacci extension. While the Fibonacci retracement helps a trader find an entry point and a stop loss, the Fibonacci extension helps a trader find potential take profit targets. Many traders combine the 2 kinds of Fibonacci to plan both the entry and the exit. For that reason, let us look at how to use the Fibonacci extension through the article below.
What is the Fibonacci extension?
Before we get into what the Fibonacci extension is, you can “go over” the Fibonacci retracement a little, through the main points below:
- In an uptrend, the Fibonacci retracement helps you estimate the price zone where the pullback may end, and there the trader looks for a Buy, expecting price to go back to the main trend.
- In a downtrend, the Fibonacci retracement helps you estimate the price zone where the rally may end, and the trader looks for a Sell, expecting price to go back to the original trend.
So if the Fibonacci retracement helps you work out the entry point while price corrects the trend, the Fibonacci extension is the tool that works out the point price is heading for. Put another way, the Fibonacci extension estimates the price zones the main trend may reach once the correction is over. If you have entered a trade using the Fibonacci retracement, the Fibonacci extension is the tool that helps you work out the exit point, the point where you take the profit.
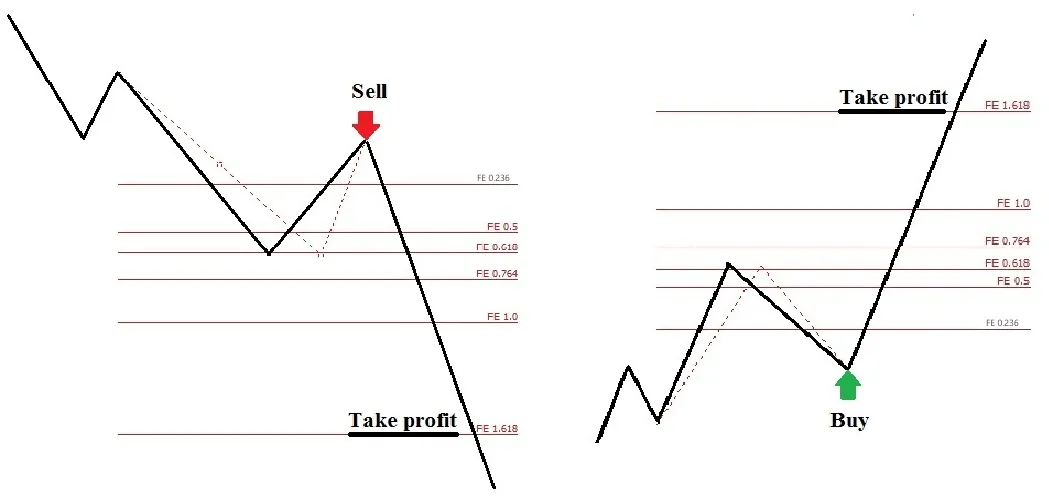
How to draw the Fibonacci extension and the potential take profit levels
To draw the Fibonacci extension on the price chart in MT4, follow this path: Insert → Objects → Fibonacci → Expansion (in some older versions it is Insert → Fibonacci → Expansion).
Once you have entered a trade with the Fibonacci retracement, you will have 3 anchor points: the lowest point, the highest point and the reversal point (the point where the correction ends).
- An uptrend
Drag the cursor from the lowest point (1) to the highest point (2) and release it, then double-click the line joining point (1) and point (2), and drag point (3) to the place where price reversed.
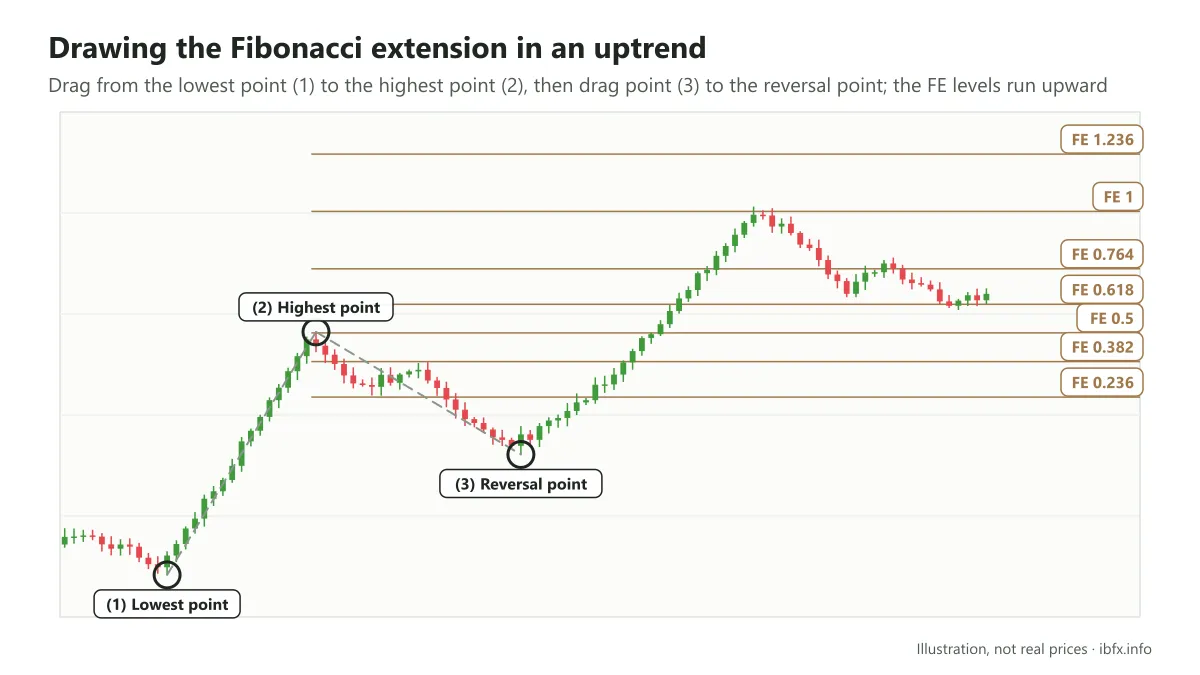
In this article, the Fibonacci extension ratios set up for an uptrend are 0.0 – 0.236 – 0.382 – 0.5 – 0.618 – 0.764 – 1.0 – 1.236 – 1.618 – 2.618… in order from the bottom up. This is a custom set of ratios: by default MT4 only shows the 3 levels 61.8, 100 and 161.8, and you can add the other levels in the settings of the tool (many traders also use 1.272 in place of 1.236).
Of these, the ratios from 0.618 to 1.618 are the potential take profit levels. The levels below 0.618 are not used much, because the reward-to-risk ratio is low; on the other hand, price rarely reaches the levels above 1.618 unless the market is in a very strong trend.
- A downtrend
Drag the cursor from the highest point (1) to the lowest point (2) and release it. Double-click the line joining point (1) and point (2), then drag point (3) to the place where price reversed.
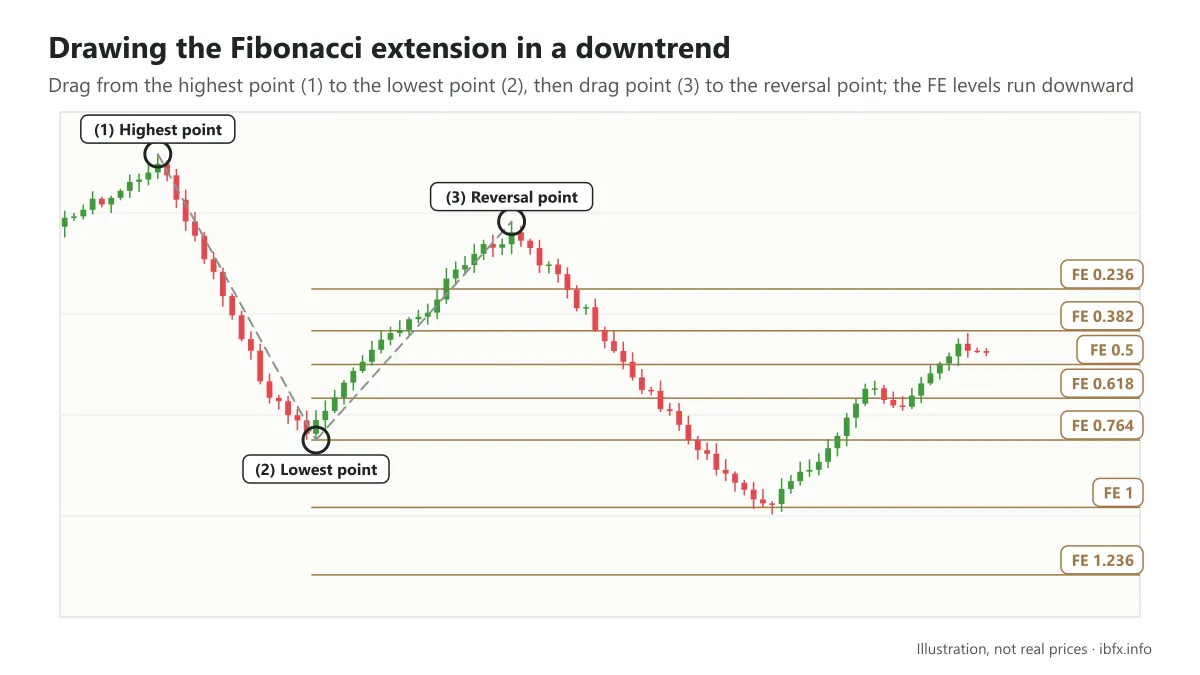
As in an uptrend, the Fibonacci extension ratios in a downtrend also include the ratios 0.0 – 0.236 – 0.382 – 0.5 – 0.618 – 0.764 – 1.0 – 1.236 – 1.618 – 2.618…, in order from the top down.
The good take profit levels run from 0.618 to 1.618.
So which of the ratios between 0.618 and 1.618 should you take profit at?
Let us look again at the example in the picture above:
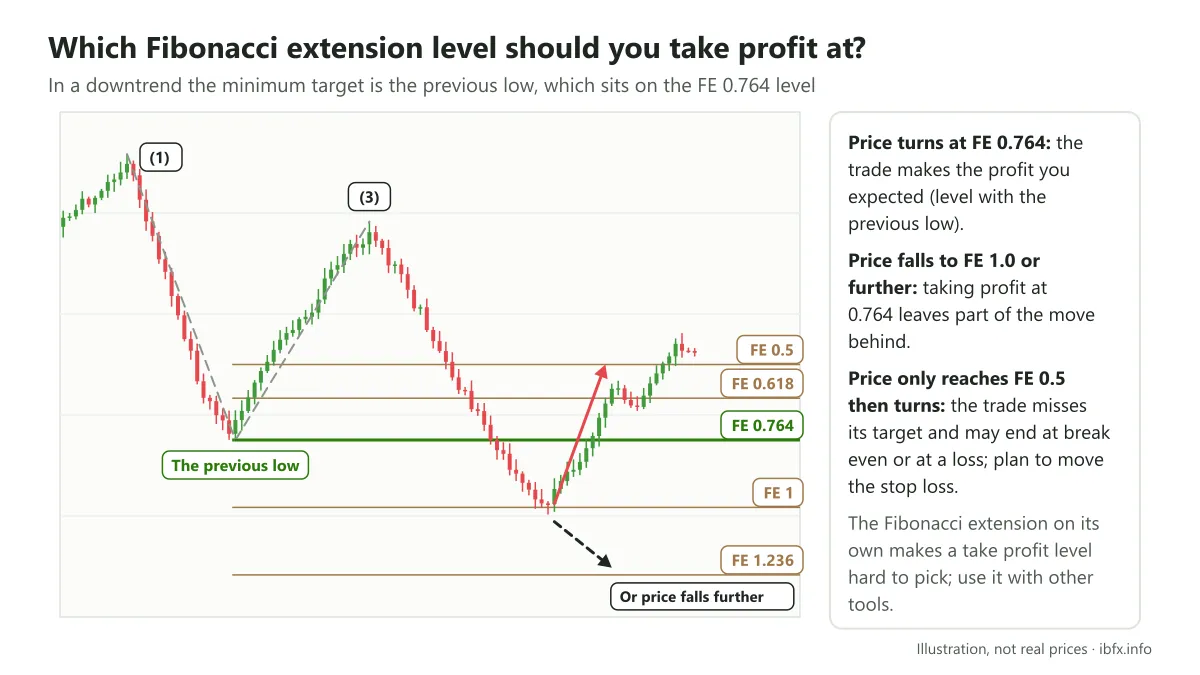
Usually, when you trade a market that is in a trend, after each correction we expect price to break the low before it (in a downtrend) or the high before it (in an uptrend), so that the trade can bring in more profit. So when you pick the exit point, you set the take profit so that, at the very least, price has to reach the price of the nearest swing high or swing low before it.
In the case shown in the picture above, the minimum profit you want is at the price of the low of the falling leg, which is the price at the 0.764 ratio of the Fibonacci extension.
- If price turns around at the 0.764 level, you get the profit you expected
- If price keeps falling further, down to the 1.0 level (as in the picture above) or even past the 1.618 level, then you have left the maximum profit behind
- If price only falls to the Fibonacci extension 0.5 level and then turns around, the trade does not reach its target and may come back to break even or to a loss, so you should plan to move the stop loss once price has run part of the way
For that reason, the Fibonacci extension on its own makes a good take profit point very hard to pick. There are many other tools that are also used to find the reversal point; combined with the Fibonacci extension, they let you pick a take profit level that makes more sense for each particular situation.
How to choose a take profit level with the Fibonacci extension
After the example in the part above, using the Fibonacci extension on its own makes a take profit level very hard to pick. Not only with the Fibonacci extension but with every other technical analysis tool, we do not encourage you to use them on their own, because no tool is absolutely accurate. Combining several tools to confirm a signal helps cut down the noisy signals, though it does not take the risk away.
There are 3 tools commonly used together with the Fibonacci extension to find a take profit point:
The Fibonacci extension together with a price channel
If you do not yet know the idea of the price channel, have a look at this article:
What is a price channel? How to identify the trend with a price channel.
To make this article easier to follow, we will go over a few of the main features of the price channel:
- A price channel is really 2 parallel lines, one of which is the trendline of an uptrend or a downtrend; the other runs parallel to that trendline and passes through the first (most recent) high or low of the trend. In a price channel, both of these lines can be called trendlines: the one above is the upper trendline, the one below is the lower trendline.
- Most of the prices of the trend sit inside the 2 trendlines. The upper trendline acts as a resistance level and the lower trendline as a support level.
- In a rising price channel, you can look for a Buy entry at the lower trendline and take profit at the upper trendline. In a falling price channel, you enter a Sell at the upper trendline and take profit at the lower trendline.
The idea behind this combination is that whichever Fibonacci extension level sits in the resistance zone of a rising price channel, or in the support zone of a falling price channel, is a better take profit level than the rest.
Example: a rising price channel on D1
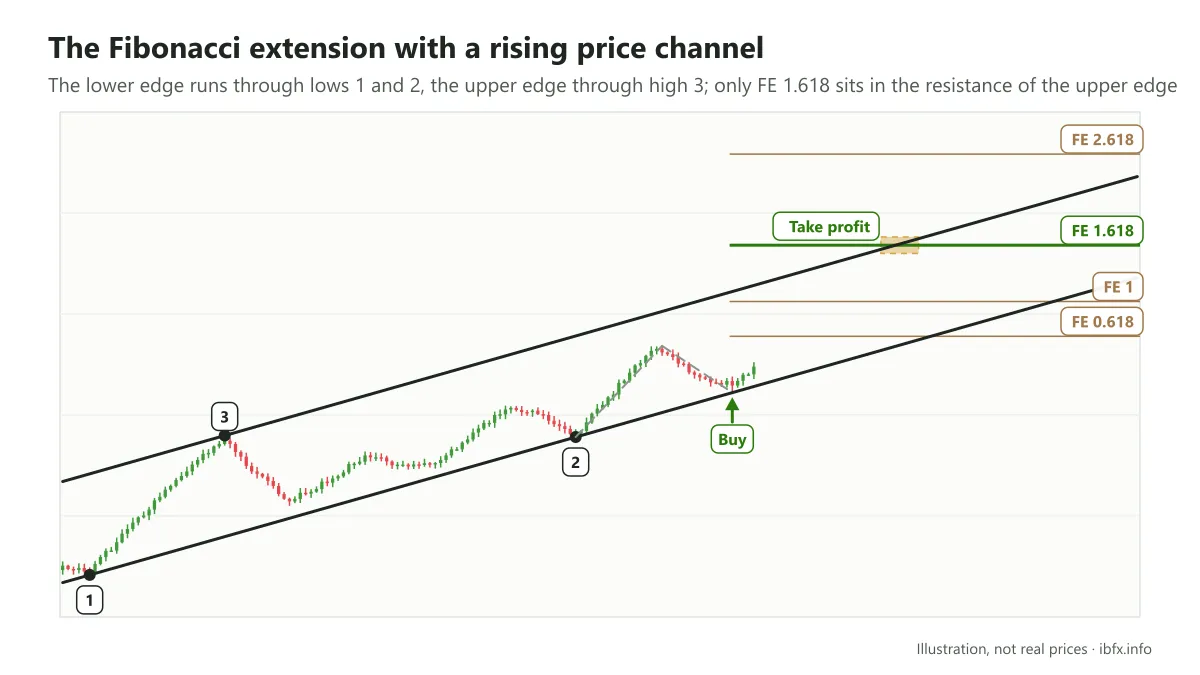
Once you have entered the Buy using the Fibonacci retracement, you draw the Fibonacci extension.
Just as expected, price carried on with the uptrend, but there is no telling when price will stop to correct downward, or reverse downward and start a new trend. There are far too many Fibonacci extension levels to choose from. At this point you can see that the uptrend has made 2 very clear lows (at positions 1 and 2), so you go ahead and draw the price channel for this uptrend. The lower trendline runs through points 1 and 2. The upper trendline runs through point 3 and is parallel to the lower trendline. The upper trendline now acts as a resistance level, and price may turn around when it touches that level.
Of all the Fibonacci extension levels, only the 1.618 level sits in the resistance zone of the price channel, and since it is also a potential take profit level, we can pick it as the take profit point for the Buy.
Let us look at the result:
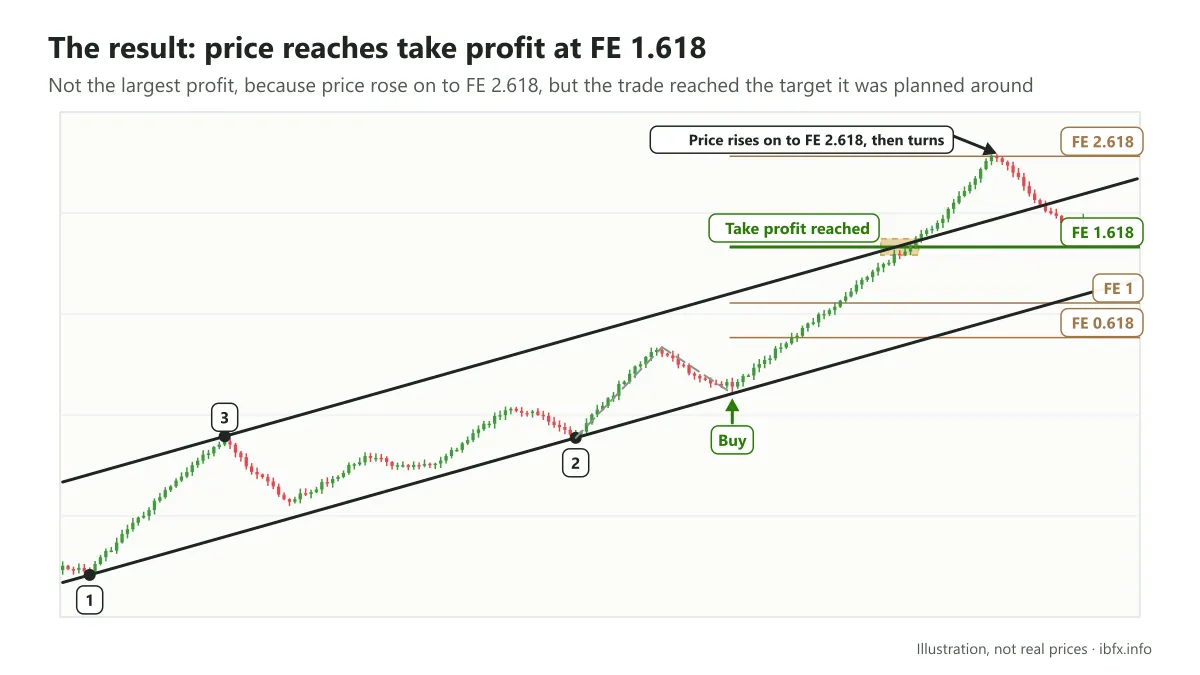
In this example, the trade reached its profit target when price touched the Fibonacci extension 1.618 level. It is true that this was not the maximum profit, because price carried on rising to the 2.618 level before it really reversed, but that is enough: do not be too greedy, be content with the target you set out to reach.
Example: a falling price channel on D1
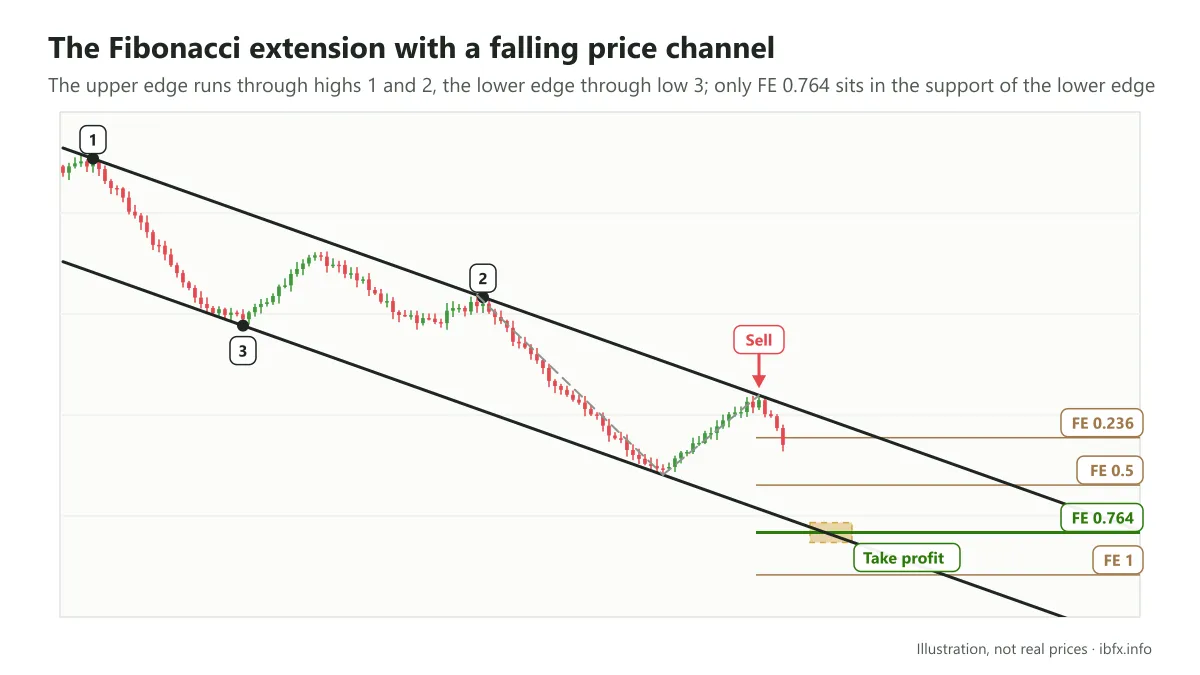
As in the case above, once you have entered a Sell thanks to the Fibonacci retracement, you draw the Fibonacci extension.
Points 1 and 2 set the upper trendline of the falling price channel, and point 3 sets the lower trendline.
Of the Fibonacci extension levels, only 0.764 sits in the support zone of the falling price channel, and price may turn back up when it touches that level.
0.764 is also a potential take profit level, so you can pick it as your take profit point.
And the result is:
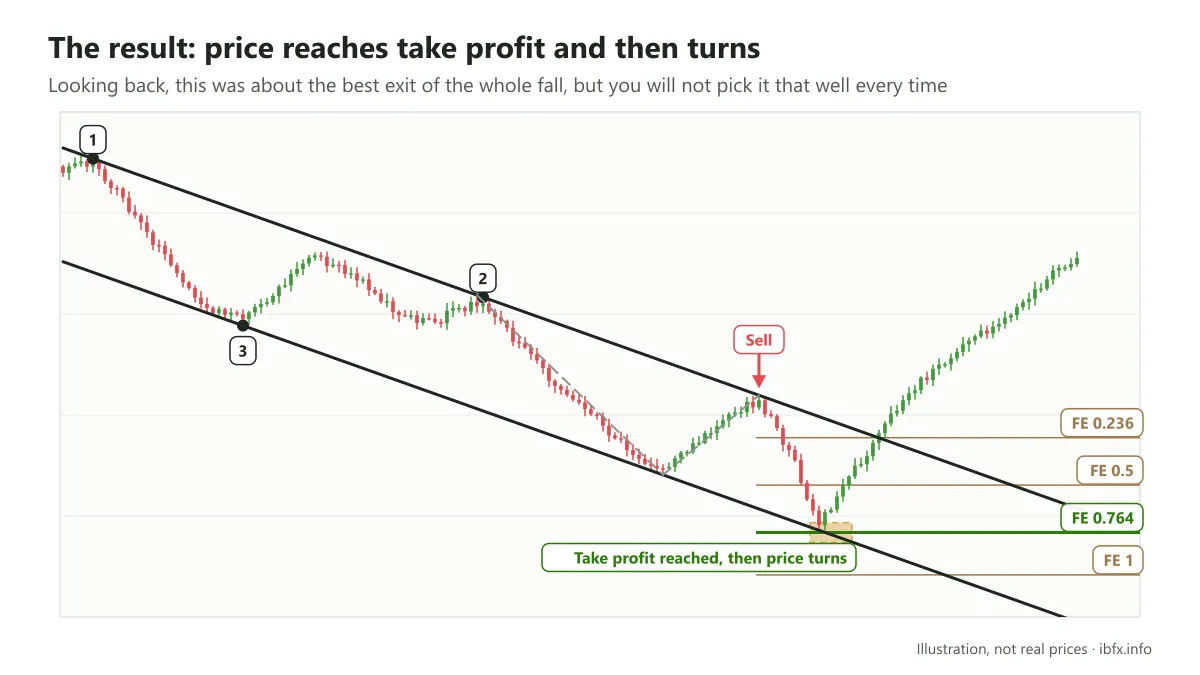
After it reached the Fibonacci extension 0.764 level, price also touched the lower trendline and began to reverse, turning into a whole new uptrend. Looking back, this was about the best exit of the whole fall, but you will not pick it that well every time.
The Fibonacci extension together with support and resistance zones
If you cannot mark out the support or resistance zones with a price channel, you can still pick a take profit point by watching the nearest important price zones (support or resistance) before it.
Price usually tends to react to these important price zones: it turns back up when it meets a support zone and turns back down when it meets a resistance zone.
So the idea behind this combination is that whichever Fibonacci extension level sits close to an important price zone is a better take profit level than the rest.
Example: a Sell on H4
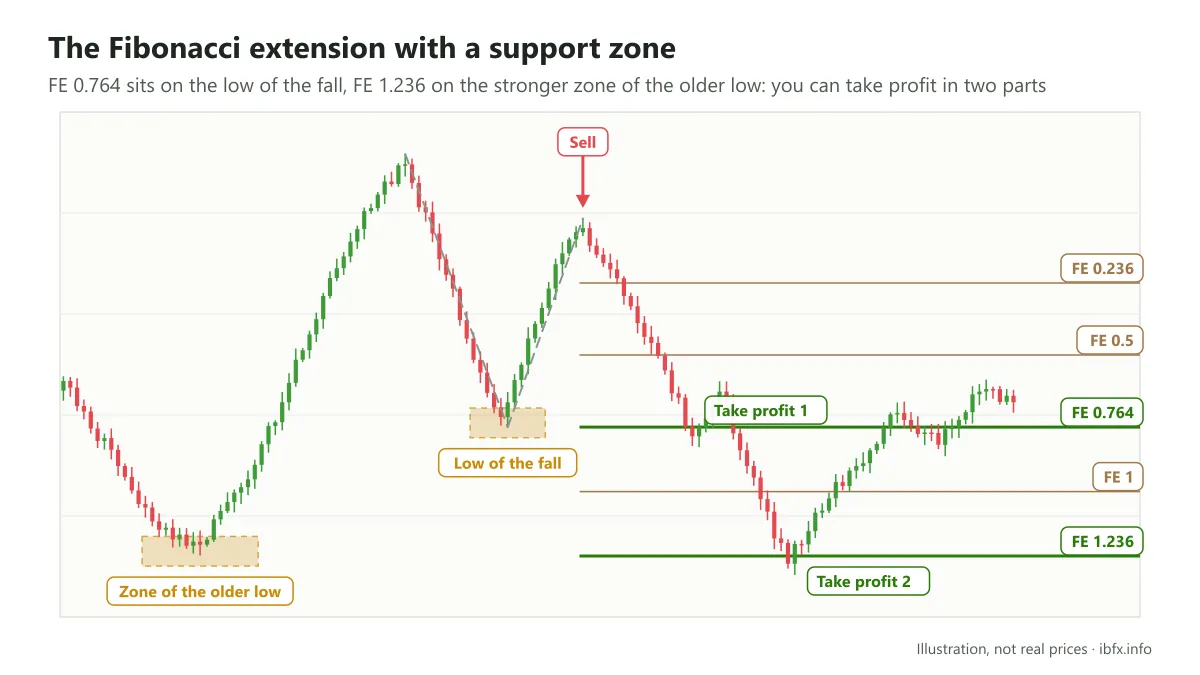
Once the Fibonacci extension is drawn, we look at the nearby price zones in the past. There are 2 Fibonacci extension levels that sit in 2 important price zones. The first is the 0.764 level, which sits in the zone of the low of the falling leg; the second is the 1.236 level, which sits in the zone of the low of the fall right before that, and this second zone is a strong support zone.
If you take profit right at the 0.764 level, you still have a profit, but not as large as the profit at the 1.236 level. Then again, there is nothing to say price will go past the 1.236 level: price may turn around before it gets through that price zone.
So when you can mark out several important price zones and those zones have strong support or resistance, you can take profit in parts. In this example, say, you could take profit on half of your position size at the Fibonacci extension 0.764 level and on the other half at the 1.236 level. This plan lets you take part of the profit and still keep the chance open if price runs further.
Example: two Buy trades on D1
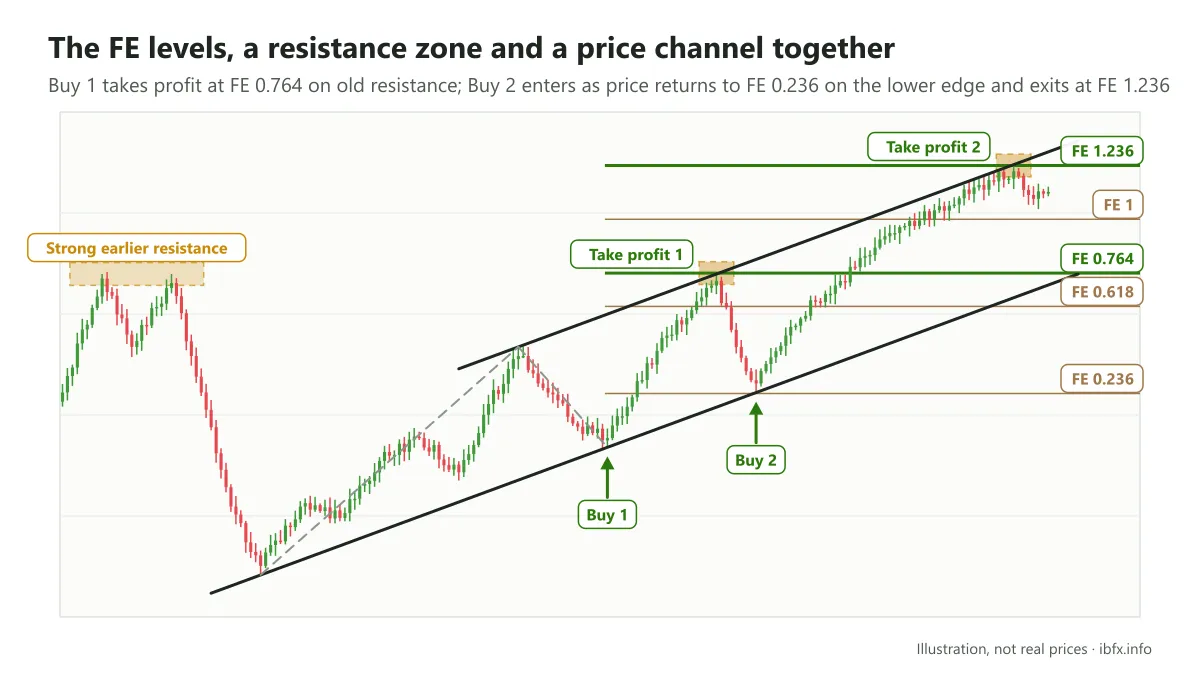
First, you can mark the 2 Fibonacci extension levels 0.618 and 0.764, which sit in 2 important price zones: the high of the rising leg, and a very strong resistance zone before it. Because these 2 price zones are fairly close together, you can pick the further one to get the most out of the move, and it is also the stronger barrier, so price is more likely to react at that price zone. Here you place Buy 1 and take profit 1.
And the result is that price really did reverse at this price zone.
The uptrend made 2 lows with a rather neat slope, a sign that the trend would carry on. You go ahead and draw the price channel for the uptrend. Right after that, price came back to the Fibonacci extension 0.236 level, and as it did so price touched the lower trendline, which makes it even more likely that price will carry on up, so you place another trade, Buy 2. At this point you use the help of the price channel to find the take profit point.
Here it is easy to see that only the Fibonacci extension 1.236 level sits in the resistance zone of the rising price channel, so you can take profit at this level.
In the situation above, with the Fibonacci extension, the support and resistance zones and the price channel all combined, you entered 2 trades and picked 2 take profit points that worked out quite well.
The Fibonacci extension together with reversal candlestick patterns
If you have read the article about how to find an entry point with the Fibonacci retracement, you will find this method easy to pick up too.
The Fibonacci retracement is combined with Japanese candlestick patterns to find the point where the correction turns around; in the same way, the Fibonacci extension is combined with Japanese candlestick patterns to find turning points, but this time of the main trend.
The idea behind this combination is that if a reversal candlestick pattern appears at a potential Fibonacci extension level, price may reverse or correct, so this is a sensible place to take profit on part or all of the position.
There are a great many reversal candlestick patterns, and you can look through them in this article: the strongest reversal candlestick patterns to know in forex.
Example: a Buy on D1
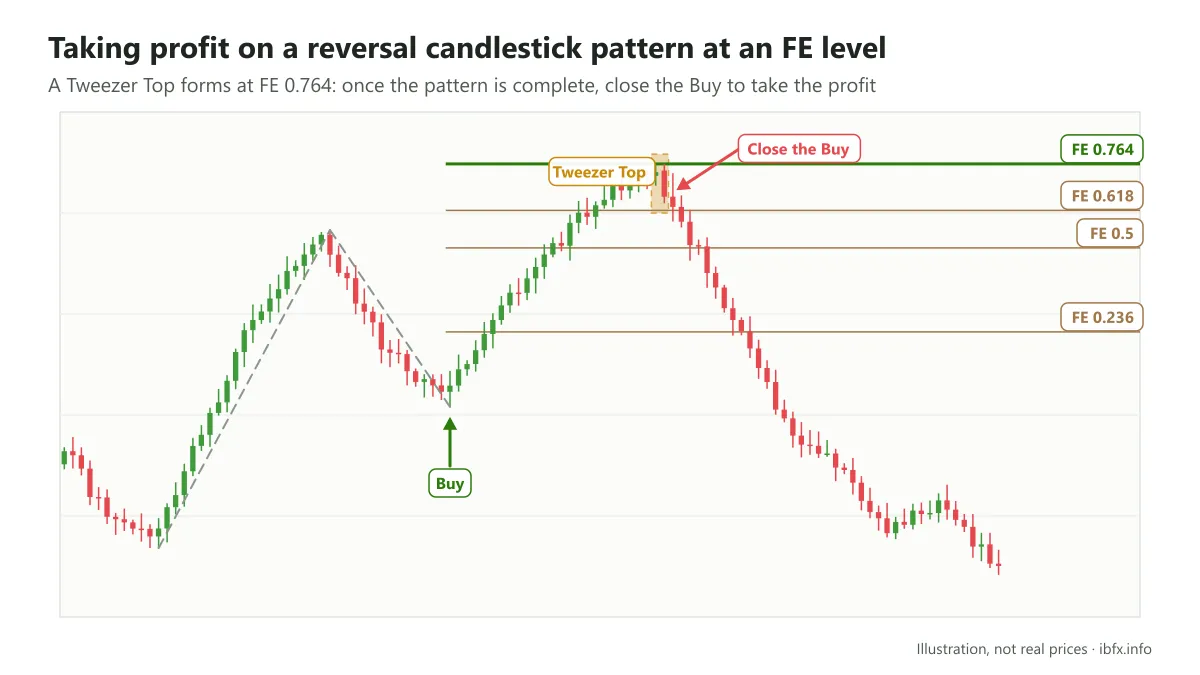
When price rose to the Fibonacci extension 0.764 level, a Tweezer Top reversal pattern formed. When that pattern is complete, you should close the Buy to take the profit. The result is that price really did reverse and start a new trend.
Example: a Sell on D1
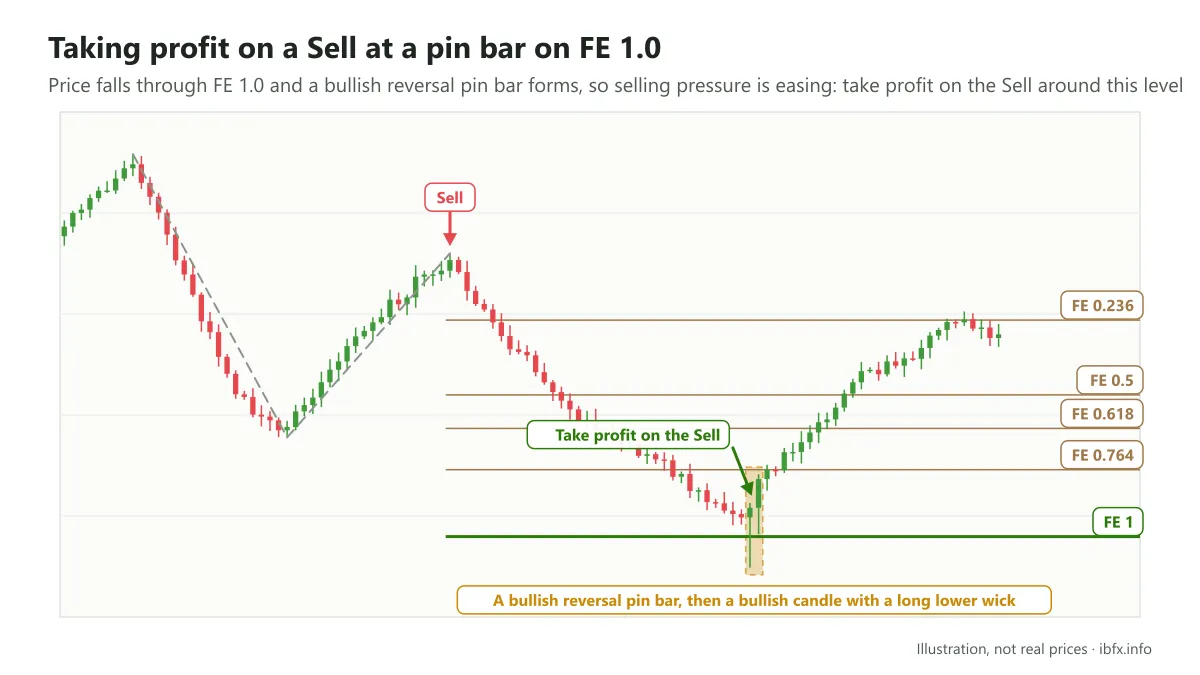
This is a Sell in a downtrend. When price fell through the Fibonacci extension 1.0 level, a Bullish Reversal Pin Bar formed, and that pin bar shows that selling pressure is easing and price may reverse. At this point you can take profit on the Sell around the Fibonacci extension 1.0 level.
A bullish candle with a long lower wick right after the pin bar makes a reversal even more likely, and the result is that price really did reverse.
Both examples above show how to combine the Fibonacci extension with Japanese candlestick patterns to find the exit point (the examples were picked once the outcome was already known). What matters is that you recognize these patterns early enough to close the trade in time. To do that, you should look deeper into the price action school of analysis.
The 3 tools we have introduced to combine with the Fibonacci extension are the ones commonly used today. No method is absolutely accurate, so practice on a demo account, always place a stop loss, and build your own way of taking profit out of these foundations.