On this page
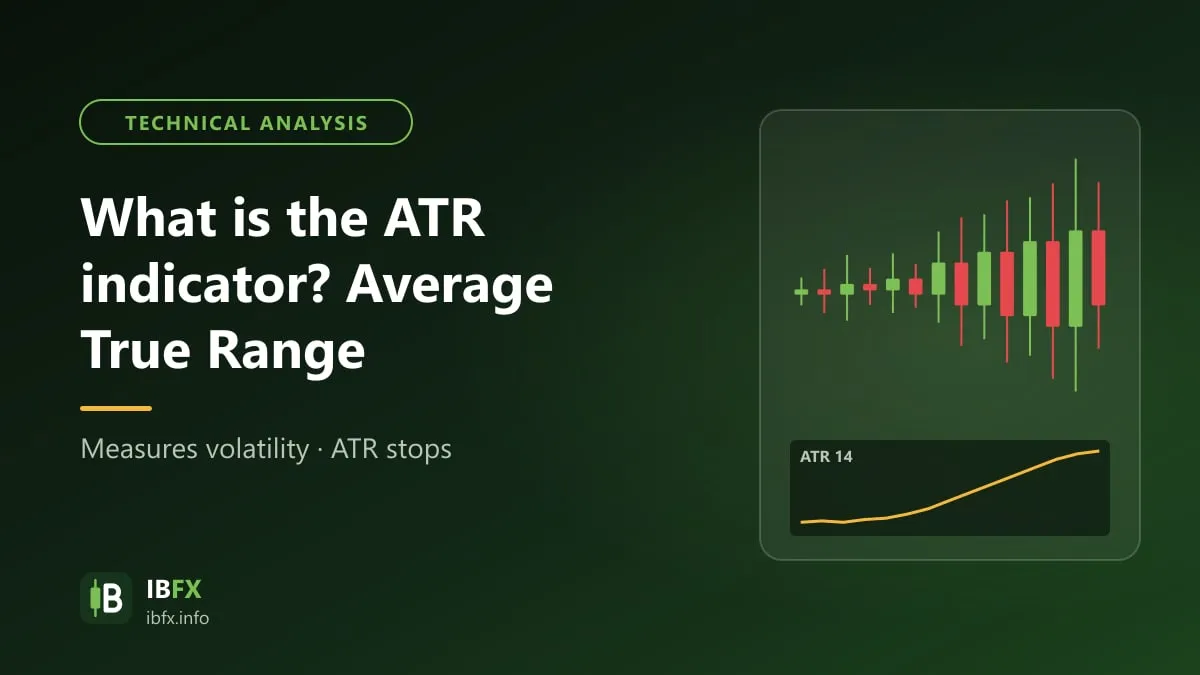
The ATR is a rather unusual indicator in forex trading. Although it is called an indicator, the ATR is not used to forecast whether price will go up or down, but to measure how much price moves.
For that reason the ATR is usually used as a tool for setting stop loss and take profit levels, far more than for finding an entry point for a buy or a sell.
What is the ATR (Average True Range) indicator?
The ATR (Average True Range), introduced by J. Welles Wilder in his well-known book “New Concepts in Technical Trading Systems” in 1978, is an indicator that measures how much price moves, counting the price gaps between sessions as well. The ATR was first developed for the commodity markets and was later applied to stocks, indices and forex.
The formula for the ATR
First of all, the True Range (TR) of each session is the largest of these 3 values:
- The high minus the low of the current session
- |The high of the current session minus the close of the session before|
- |The low of the current session minus the close of the session before|
The ATR is the average of the TR over a number of sessions, 14 by default. The ATR is worked out in price units (for a currency pair it can be turned into pips), so the ATR of one currency pair cannot be compared directly with the ATR of another.
What the ATR tells you
At the time Wilder introduced the ATR, the commodity markets moved very hard and often left price gaps on the chart. So Wilder built an indicator that reflects the full range of a price move, including the part created by a price gap.
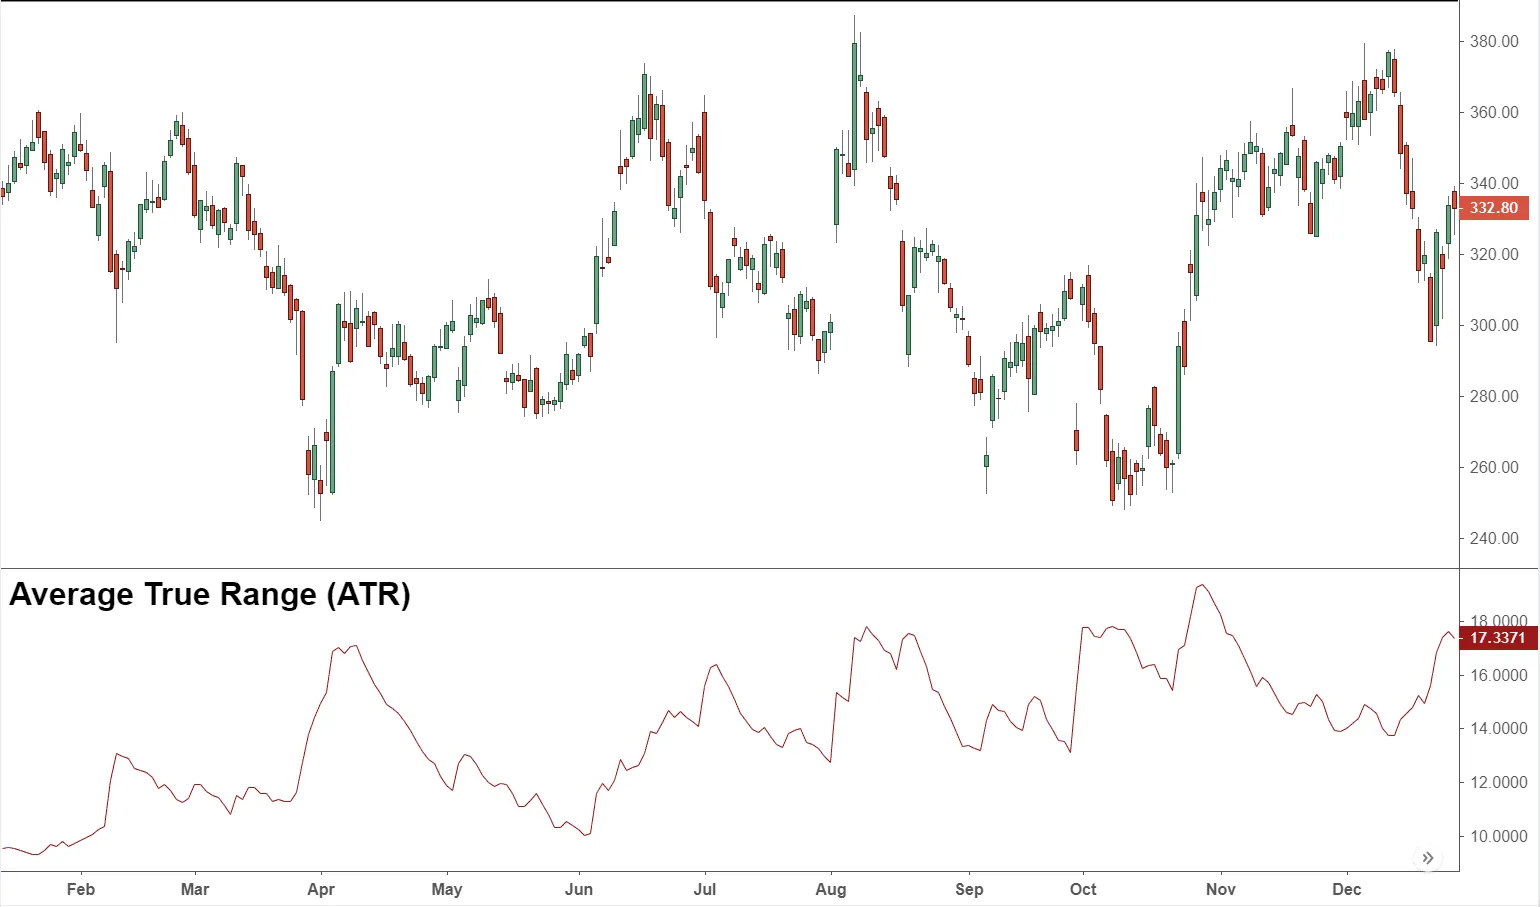
Put simply, an asset that moves a great deal will have a higher ATR, and an asset that moves little will have a lower ATR. When price reverses along with a sharp rise in the ATR, that shows the move is happening with a large range.
The ATR does not tell you which way price is going, nor which side, buyers or sellers, has the upper hand: a sharp rise in the ATR can happen when price rises hard or when price falls hard. A very high ATR is usually the result of a sudden burst up or down, and that amount of movement usually does not last long.
When the ATR is low, price is moving “quietly”, which often happens when the market goes sideways. If that state lasts, the market may be in consolidation and a strong move may be coming, but the ATR does not tell you which way it will go.
Because it reflects changes in how much price moves, the ATR can help a trader filter when to trade, for example staying out of the market when it is moving too little, or paying attention when movement starts to pick up out of a consolidation.
How to set up the ATR indicator in MT4
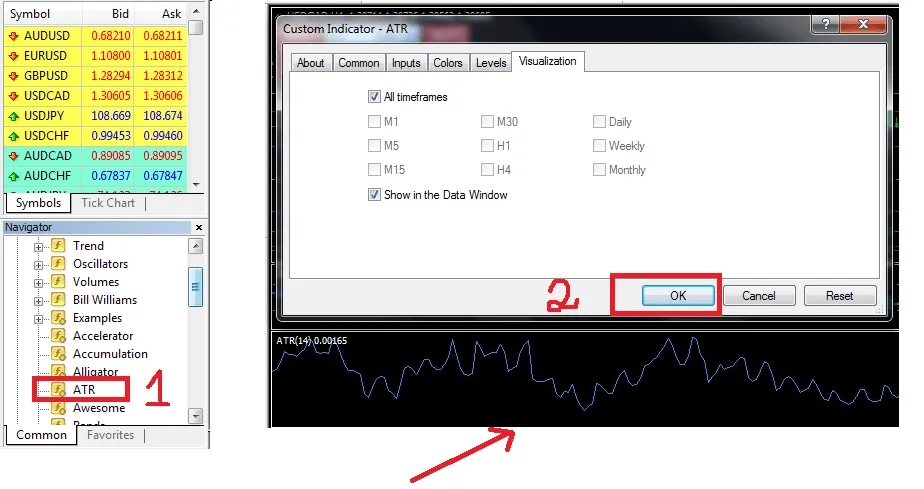
In MT4, go to Insert → Indicators → Oscillators → Average True Range (the dialog in the picture below says “Custom Indicator” because that is an ATR added by hand; the one built into MT4 sits at the path just given); or open the “Navigator” window on the left, find Average True Range under Indicators, double-click it, then click OK in the settings box (the default period is 14). You can look at the picture below:
How to use the ATR indicator in forex trading
Using the ATR to place a stop loss and a trailing stop
The ATR is used most commonly to work out the stop loss distance. When the ATR is high, price can swing harder, so a trader places the stop loss further away to avoid being taken out. The other way around, when the ATR is low a trader can place the stop loss closer, because price moves less.
One common way is to place the stop loss about 1.5 – 2 times the ATR away from the entry point. For instance, if the ATR(14) on the H4 chart of EUR/USD is 20 pips, the stop loss can be placed about 30 – 40 pips from the entry. One important note: if the stop loss is further away, you have to cut the position size, so that the amount of money at risk on each trade stays inside the limit you set yourself (1–2% of the account, for instance).
A trailing stop is a way of moving the stop loss along with price to hold on to the profit you already have: as price moves your way, the stop loss is moved along with it; when price turns around and reaches the stop loss, the trade is closed to keep part of the profit.
The hard part of a trailing stop is choosing how many pips to leave. The ATR helps make that distance fit the market conditions of the moment better: it keeps you from placing the stop loss too close when the market is moving hard, or too far when the market is moving little.
Using the ATR to find a take profit point
The ATR also helps you set a take profit target that is more realistic.
Compare the current ATR with the range the ATR itself has moved in over a recent stretch of time (a few months, say). If the ATR is sitting in the upper half of that range (a lot of movement), you can set the take profit target further away than usual. If the ATR is in the lower half (little movement), you should set the target closer, for example aiming only at the minimum target of the chart pattern. If the ATR is in the lower half but climbing, you can consider a further target.
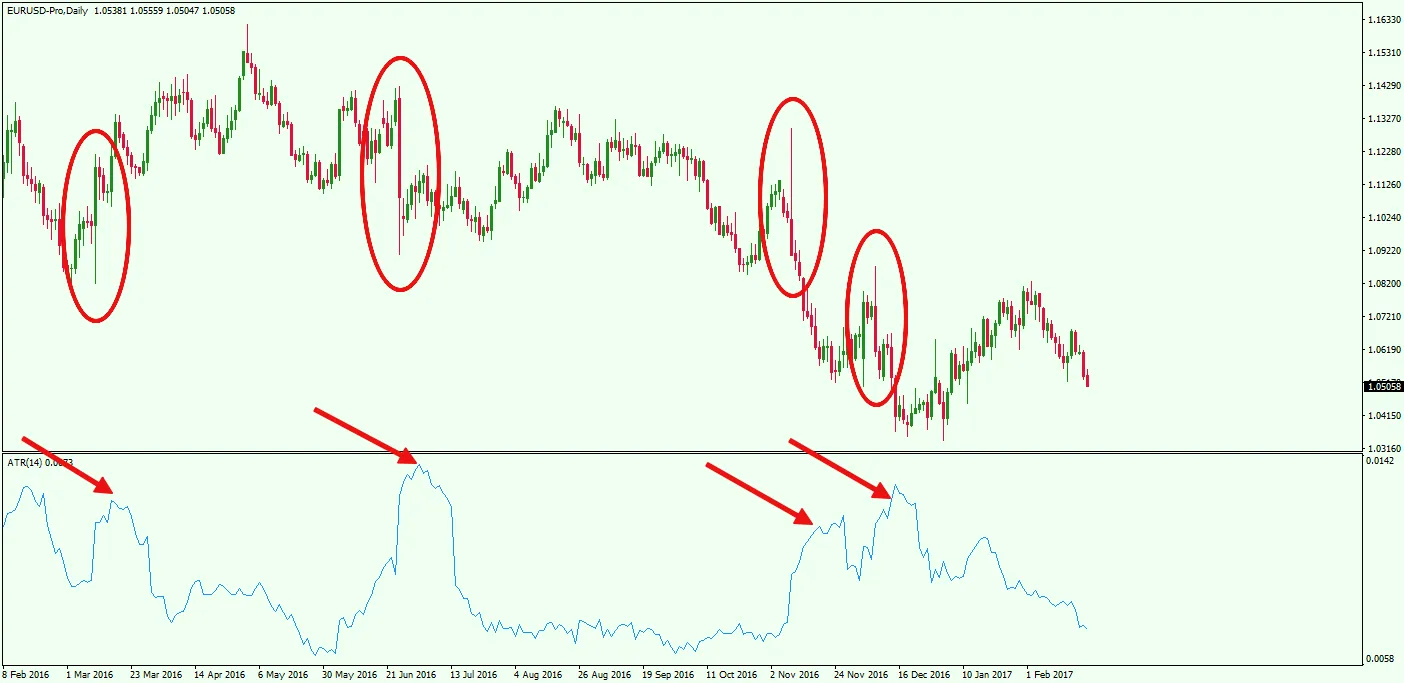
In the example above, look at EURUSD with the ATR indicator below it. The red arrows on the ATR indicator show that the ATR is sitting in the upper half of its own range, which means price is moving a great deal.
The clusters of candles circled on the chart have very long wicks. When there is that much movement, placing a trailing stop or a stop loss too close makes it very easy to be taken out before price goes the way you expected.
The other way around, when the ATR is low the market is fairly quiet. At times like that you can place the stop loss closer, and the take profit should be smaller too, because price may not travel far.
The ATR also helps you anticipate how much price will move over the period ahead (not which way it will go). If the ATR line is climbing, movement is likely to stay high; if the ATR is sloping down, movement is easing off. You should pay attention to the moments when movement turns from low to high or from high to low, so you can adjust your stop loss, your take profit and your position size to fit the new market conditions.