MACD is the indicator that changed the way I saw things while I was learning to trade Forex. Back when I first stepped into this market I was busy hunting down every kind of indicator to look at. And I usually only tried to know what they were for, without digging into how they are built, or sitting down and asking myself why the formula is the way it is…
Because I did not really understand what lies underneath, I used to apply things by rote and could not read clearly the signs the indicator was giving.
Later, as what I had studied and read began to sink in, I slowly changed the way I looked at it and tried to dig deeper into what each indicator is really saying.
Of course everyone sees a question differently, so you do not have to do it the way I do. But understanding how an indicator is calculated helps you know when its signal is reliable and when it is likely to be wrong.
If you are interested in MACD, read the article below. Following on from what I said above, though, I am going to explain some parts in detail; if you do not feel you need that, you can scroll straight down to the part on how to trade it.
What is MACD?
The name says it all: MACD is short for the 4 words Moving Average Convergence/Divergence, one of the momentum indicators, developed by Gerald Appel in the late 70s. MACD is also one of the few indicators whose name alone describes most accurately the value they produce.
The name “convergence/divergence” refers to the fast and slow EMA lines moving closer together (convergence) or further apart (divergence). In practice MACD is used for 2 main jobs: measuring the momentum of price (including looking for divergence and convergence between price and the indicator) and working out the trend.
These are also the 2 questions every trader cares about when they trade forex.
How MACD relates to EMA
Before we dig into MACD, we will say a few words about EMA. Other indicators usually base their formula on some fixed period, but with MACD, EMA is the main material it is built from.
EMA, the exponential moving average, is called exponential to tell it apart from another kind of moving average called SMA, the simple moving average.
Working out a moving average is fairly simple: it is the arithmetic mean of price over a given period; SMA14, for example, is the price of 14 sessions added together and divided by 14.
The biggest difference between SMA and EMA is that EMA reacts faster to recent price. Because the data used to calculate EMA can be seen as cancelling out, or decaying geometrically, the further back it goes, the EMA line ends up closest to the price of the moment.
Note: the MACD indicator uses EMA (EMA 12 and EMA 26 by default) rather than SMA; on MT4 in particular, the default signal line is calculated with SMA 9.
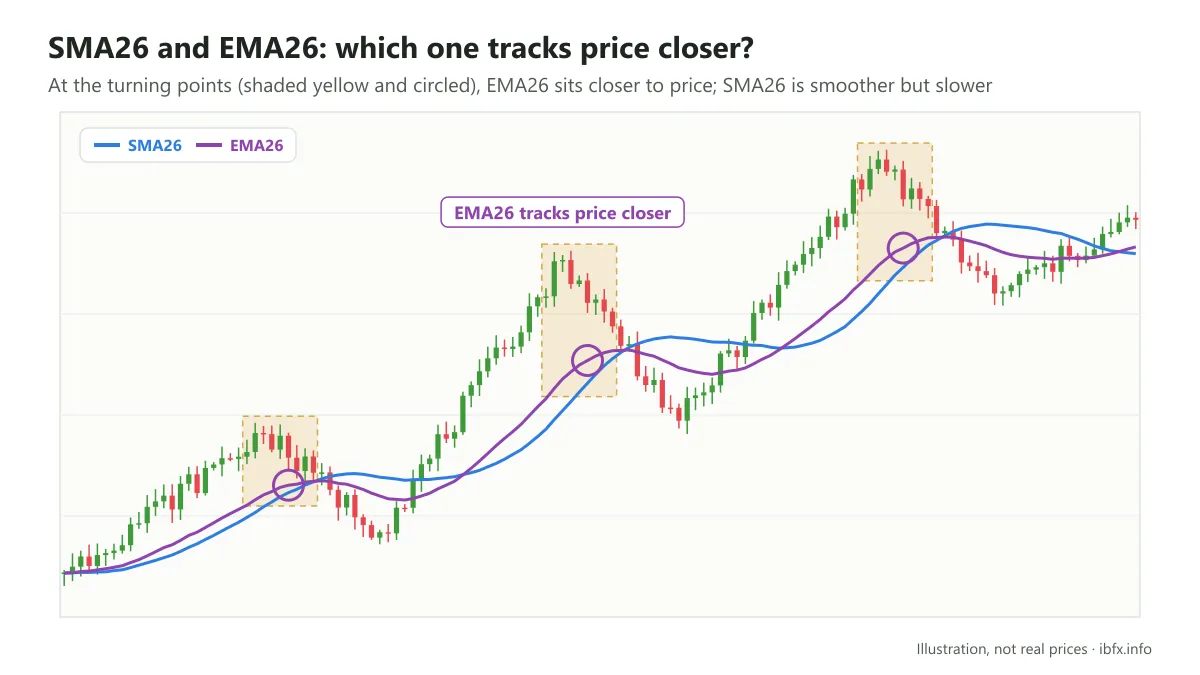
Looking at the picture above, the SMA line clearly runs further from the price line; look at the points shaded yellow and circled and you will see it. That means EMA tracks price closely and reacts faster, while SMA is smoother but slower.
It is exactly because it tracks the price line that the MACD formula brings out those 2 things clearly: trend and momentum.
The parts of MACD and its formula
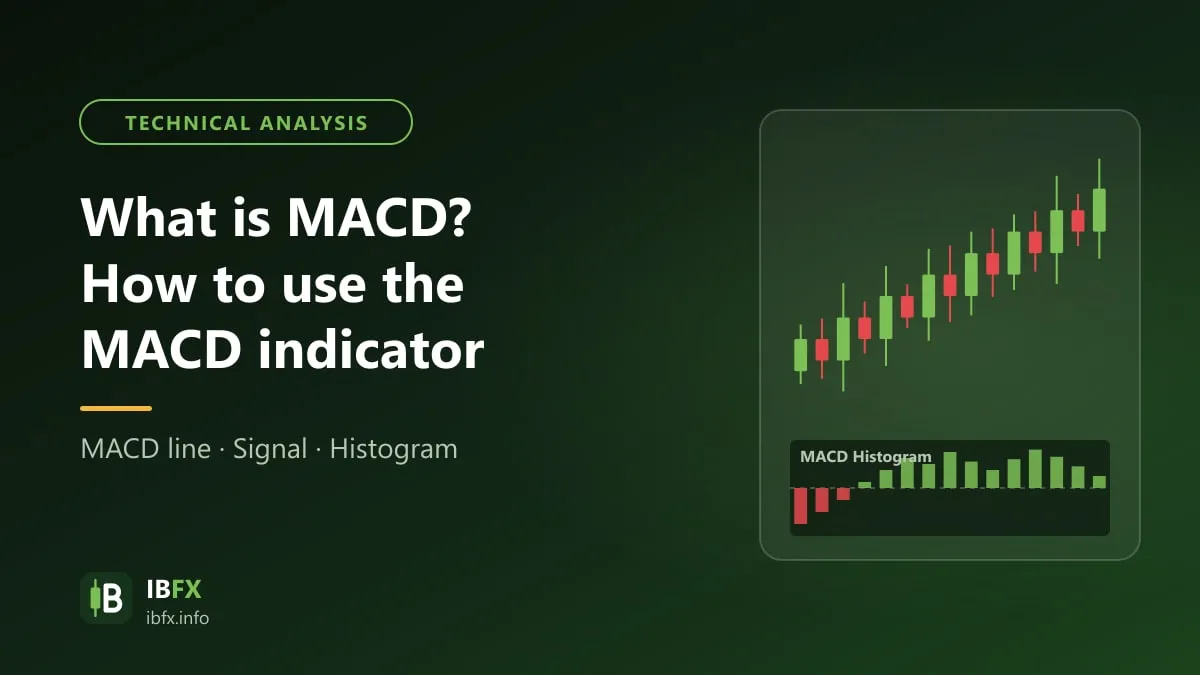
Compared with RSI or Stochastic, MACD is built in a more complicated way, out of 4 parts:
- The MACD line (the blue line, also called the fast line)
- The signal line (the orange line) or slow line
- The Histogram area (the bar chart)
- The Zero line (level 0): where EMA 12 equals EMA 26; the MACD line sits above 0 when the fast EMA is higher than the slow EMA, and the other way round
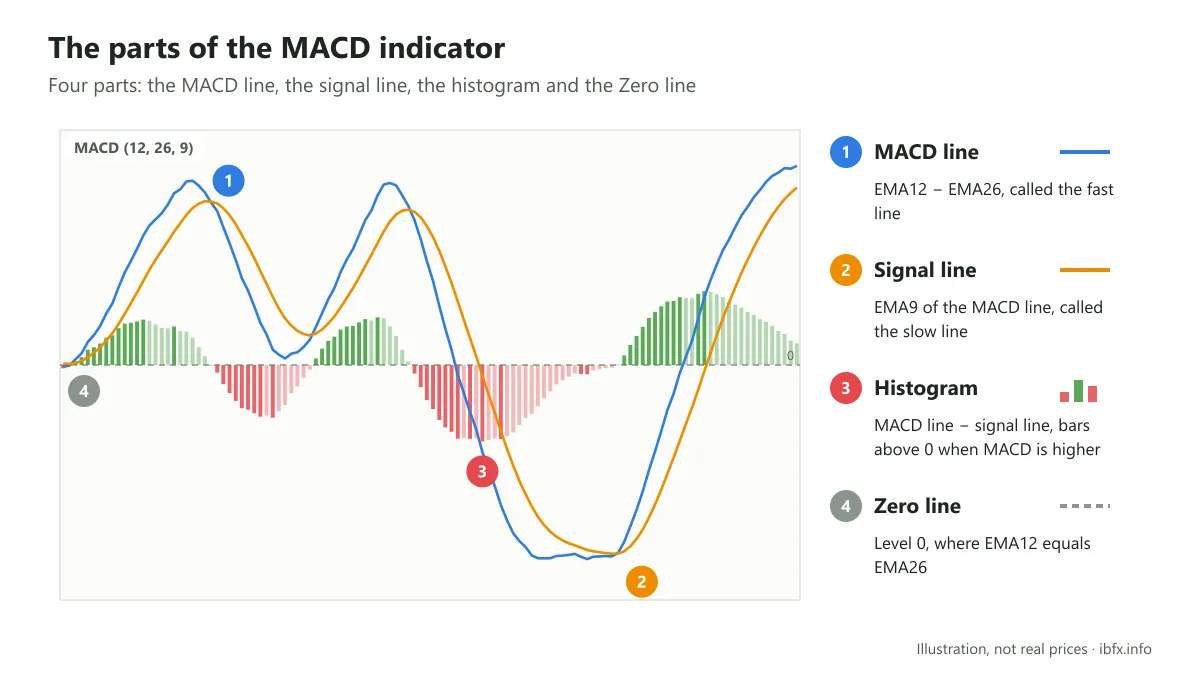
The formula is as follows:
The MACD line: EMA (period 12) – EMA (period 26)
The signal line: EMA9 of the MACD line
MACD Histogram: the MACD line – the signal line
-The MACD line: measures the distance between the short term moving average (12) and the long term one (26). To make this clearer, let’s look at the example below:
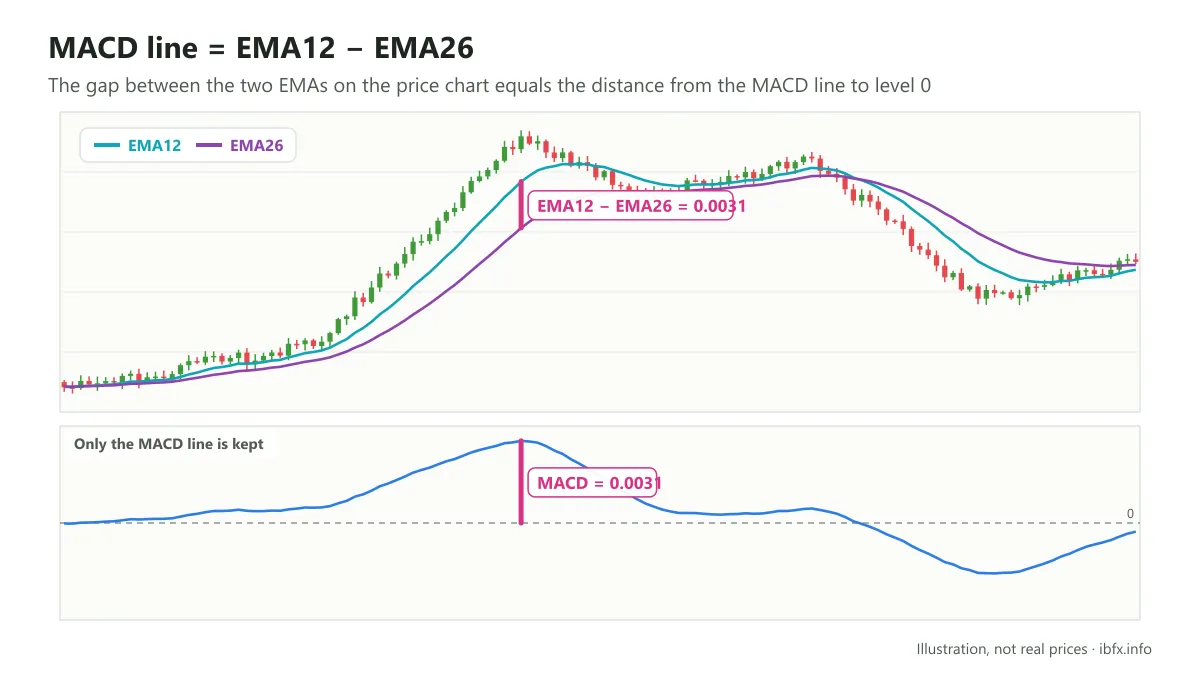
In the picture above I have removed the signal line and kept only the MACD line. The pink segment shows that the distance from the MACD line (in blue) to the Zero line is exactly the faster EMA (period 12) minus the slower EMA (period 26). As you can see, the two pink segments are the same length.
On top of that, they give you one more signal: the distance between those two averages is also what is used to measure the momentum behind the market’s moves.
And because it is worked out from a difference, the MACD line always swings around level 0: positive when the fast EMA is above the slow EMA, negative when the fast EMA is below the slow EMA.
Which means: if the difference of the fast line is greater than the slow line, it sits on the positive hill; the other way round, if the fast line is smaller than the slow line, MACD sits on the negative hill, below the zero area.
So the 2 points to remember about MACD are:
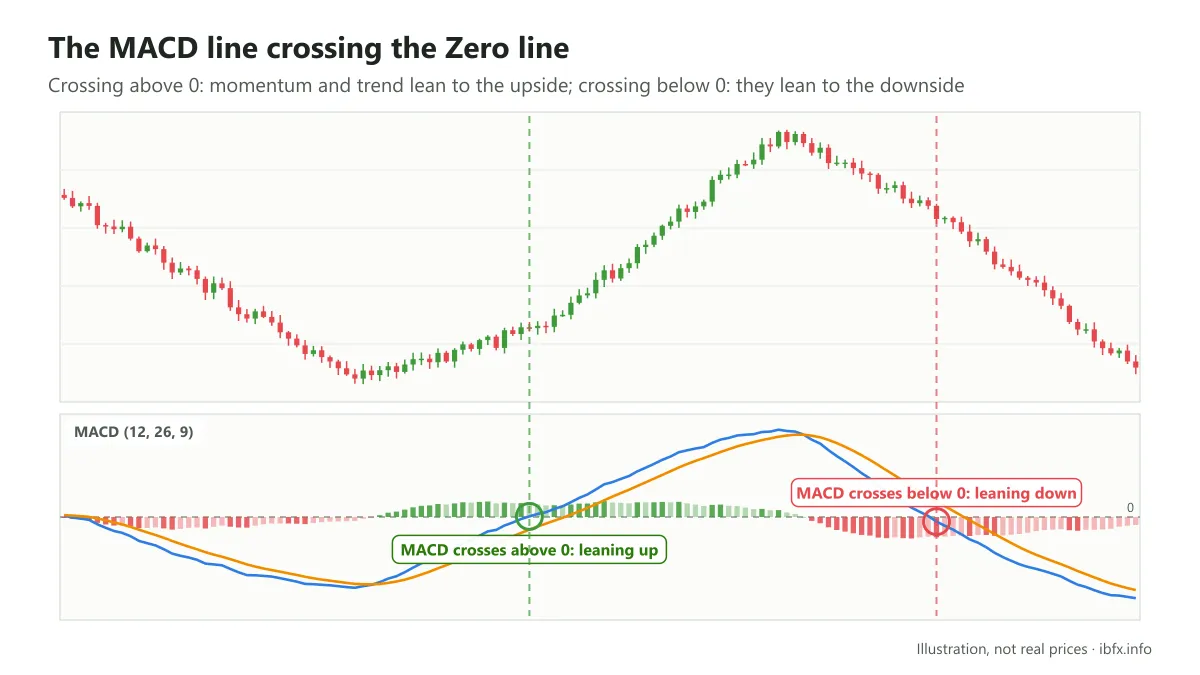
- When the MACD line crosses the Zero line going up from below, that is a sign that momentum and trend are leaning towards rising prices.
- When the MACD line crosses the Zero line going down from above, that is a sign that momentum and trend are leaning towards falling prices.
-The signal line: is created from the MACD line itself with a period of 9, that is EMA 9. Because it is an average of the MACD line itself, the signal line reacts more slowly, which is why it is called the slow line.
So the signal line always follows the MACD line and helps you easily spot a signal when those 2 lines cross each other.
- The MACD line crosses above the signal line: a signal that momentum is rising
- The MACD line crosses below the signal line: a signal that momentum is falling
Note: I am talking about this crossover signal on its own; when you trade you should combine the signal with the Zero line and the Histogram.
-The Histogram: is used to measure the gap between the fast MACD line and the signal line, shown as bars running up or down.
Taking the zero line as its base, the histogram swings around that area. If the MACD line is greater than the signal line, that means positive hills are formed. If the MACD line is smaller than the signal line, negative hills are formed (below the zero line).
On top of that, if you look carefully you will see that these bars are not the same size, they are longer or shorter, to carry information about the momentum of price.
If price keeps rising but the histogram formula produces bars that get shorter and shorter, that shows the strength is fading and price may pull back or turn.
Note: because it forms peaks, a great many traders use only the Histogram when they apply patterns or forms of divergence and convergence to trade.
How to set up MACD on MT4 and TradingView
With TradingView, you just go there and type MACD, and you can start using it.
In MT4 the default MACD indicator (Insert → Indicators → Oscillators → MACD) shows the MACD line as bars and the signal line as a line (calculated with SMA 9), without the difference histogram you get on TradingView. If you want it to look like TradingView, you can use a custom build of MACD, but only download it from a trusted source such as the official MQL5 library.
See also: What is TradingView? A guide to using TradingView
What is MT4? A detailed guide to using MetaTrader 4
How to trade with MACD
As I said, because MACD is built in a complicated way, the way you trade with MACD gets adapted by each trader.
Many traders use only the divergence and convergence side of it, together with other indicators, and that can be seen as the most common approach.
MACD has quite a few other fine points in it that you should not miss, though. In this article I will mainly cover the most basic forms, to show traders new to the job how to trade with MACD.
So MACD has 2 main ways to trade it:
- Using the MACD indicator on its own to trade
- Combining MACD with other indicators, reversal candlestick patterns and a few other tools
In essence an indicator is created to look for the trend, which covers signalling that the old trend carries on, or that the trend reverses.
And the more indicators agree in warning about one of those 2 trends (usually a trend reversal), the better losses can be cut down.
That is why using just 1 indicator, MACD in this case, can still work, but the risk that comes with it is very large.
So we still encourage you to combine several indicators (at least 2), or at least 1 indicator together with watching resistance and support levels or reversal candlestick patterns, which will work better.
Trading with the MACD indicator (and nothing else)
Trading when the MACD line and the signal line cross each other
Because the signal line is created from the MACD line itself, 2 cases can happen:
-The MACD line runs alongside the signal line.
-The MACD line crosses the signal line.
Case 2 is also one of the simplest methods for trading with MACD. That is:
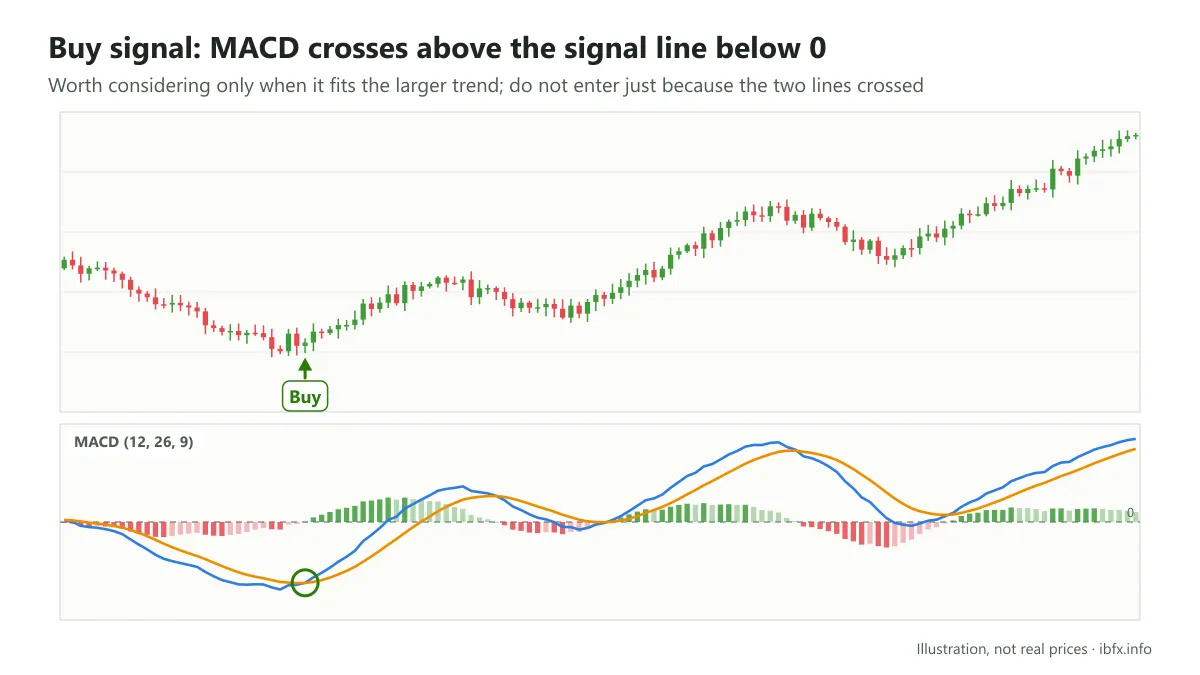
- When the MACD line crosses above the signal line while both are still below the Zero line, that is a sign of a rising market >>> BUY
- When the MACD line crosses below the signal line while both are still above the Zero line, that is a sign of a falling market >>> SELL
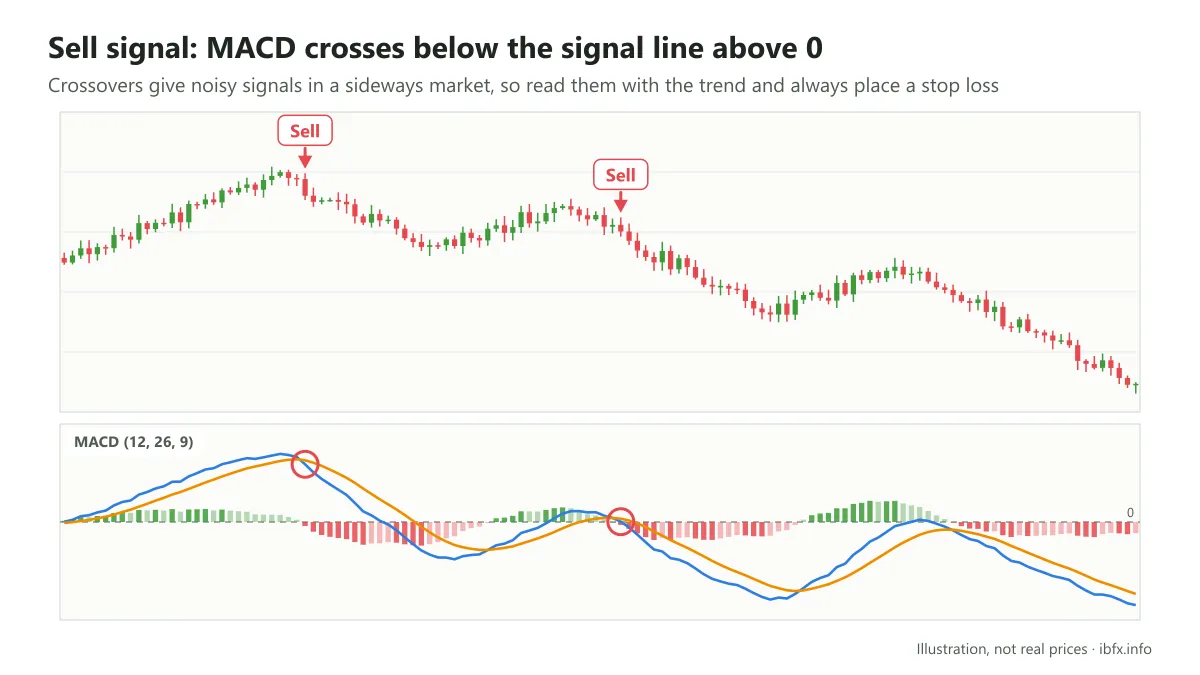
Looking at the pictures above, you can see that price really does turn when the MACD line crosses the signal line from above, or from below.
Trading forex is not as simple as eating a sweet, though, and not as clear cut as 1+1=2; so if you only use it this way, without working out the trend, and enter every time you see the 2 lines cross, you may very well lose money.
Trading MACD across multiple timeframes
This is the way that helps cut down risk compared with the method we have just described, because once the trend has been clearly worked out, trading only with the flow of the market, even off the crossovers alone, usually filters out plenty of noisy signals.
The general rule of this approach, not just with MACD but with every other indicator, is this: you work out the trend on the higher timeframe first, then use the smaller timeframes to look for the entry.
If you do not yet know how to work out the trend, you can go back to our article on how to analyze Japanese candlestick charts to understand it better:
Note: traders usually work out the trend from the higher timeframe down to the smaller one, and the most common timeframe for working out the trend is D1.
The simplest way to work out the trend is to apply Dow theory: an uptrend always makes highs that are higher than the previous high, and lows that are higher than the previous low. The other way round, a downtrend makes lower lows and lower highs.
Once you know the trend, the next thing to do is look for the entry on the smaller timeframes, which could be H4 or H1, along these basic lines:
- With D1 in an uptrend, look for the entry on H1 when price pulls back down and at the same time the MACD line crosses above the signal line.
- With D1 in a downtrend, look for the entry on H1 when price bounces and at the same time the MACD line crosses below the signal line.
Let’s look at the example below to understand it better:
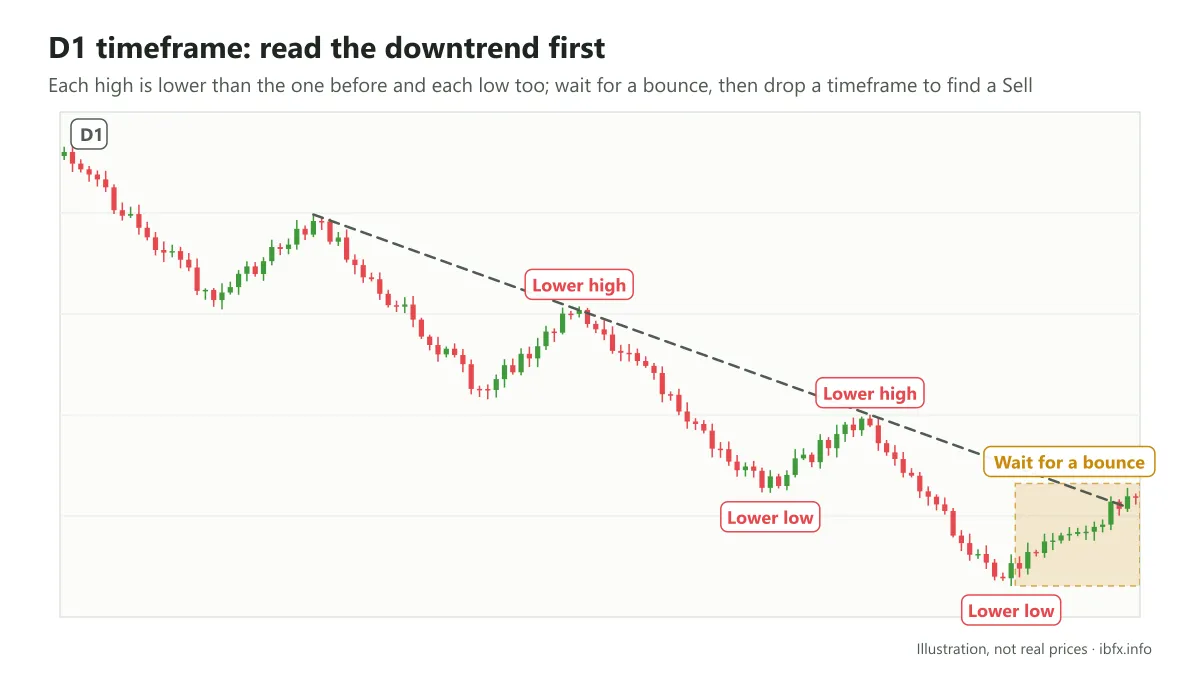
Suppose that, after watching, you see that the primary trend is a downtrend on the D timeframe: you then start waiting patiently for price to bounce, and once the MACD line crosses the signal line on H1 at the same time, you can start to enter.
Now you go to the smaller timeframe to look for the entry:
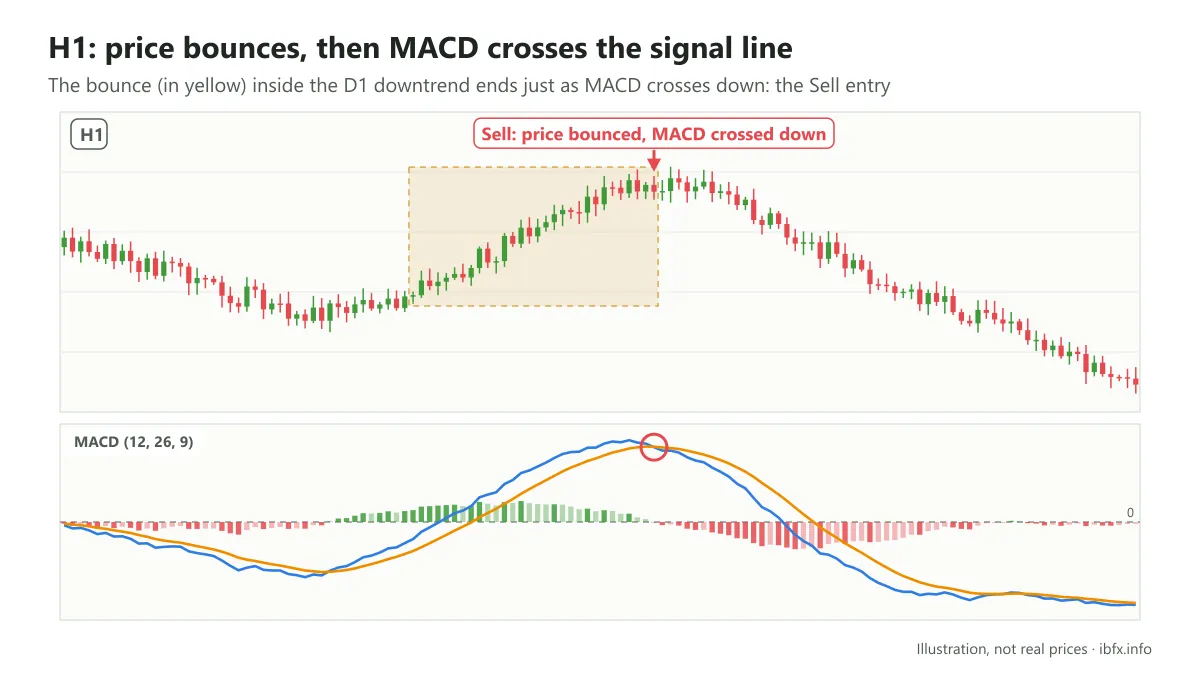
On H1 price has clearly bounced and at the same time the MACD line crosses the signal line, so you can go ahead and enter.
Trading MACD with divergence and convergence
So in this case, if you use the MACD indicator and nothing else, you can combine 3 things:
- Work out clearly whether the trend is up or down on the higher timeframes
- On the smaller timeframe, price starts to form divergence or convergence.
- The Histogram bars start to move from negative to positive, or the other way round from positive to negative
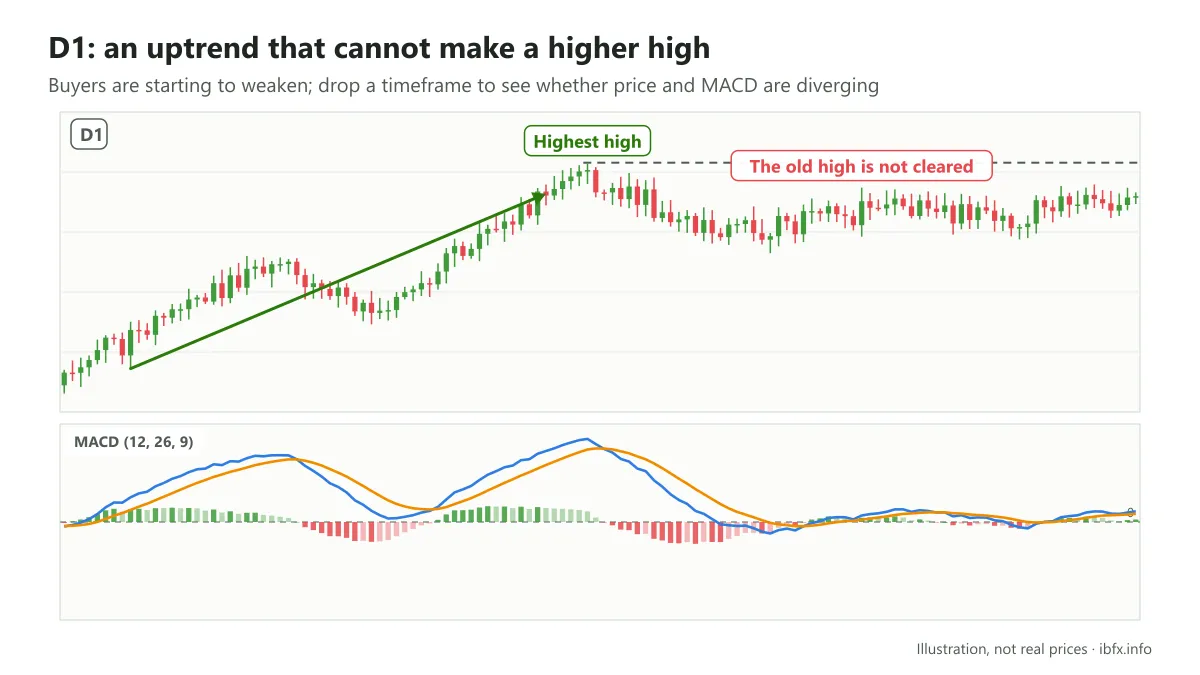
As you can see, the trend of the currency pair in the example is an uptrend, but after that price cannot make a higher high.
If you now check down on a smaller timeframe such as H4, you will see that a divergence has been formed.
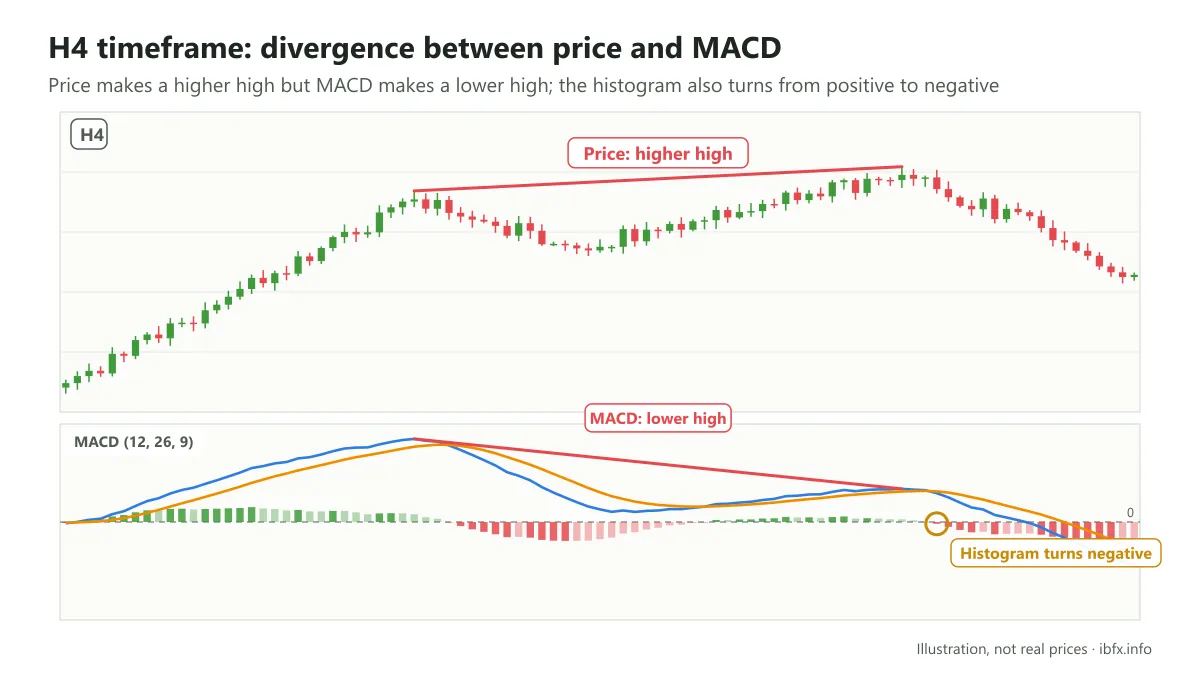
Besides that, right at the point of the divergence the Histogram bars also start to move from the positive hill to the negative hill, which shows price may fall.
And as you can see, price then fell quite a long way.
In practice, if you use just 1 indicator, you can combine several signals and still get a fairly good result; what matters is whether you can see those things while you are trading.
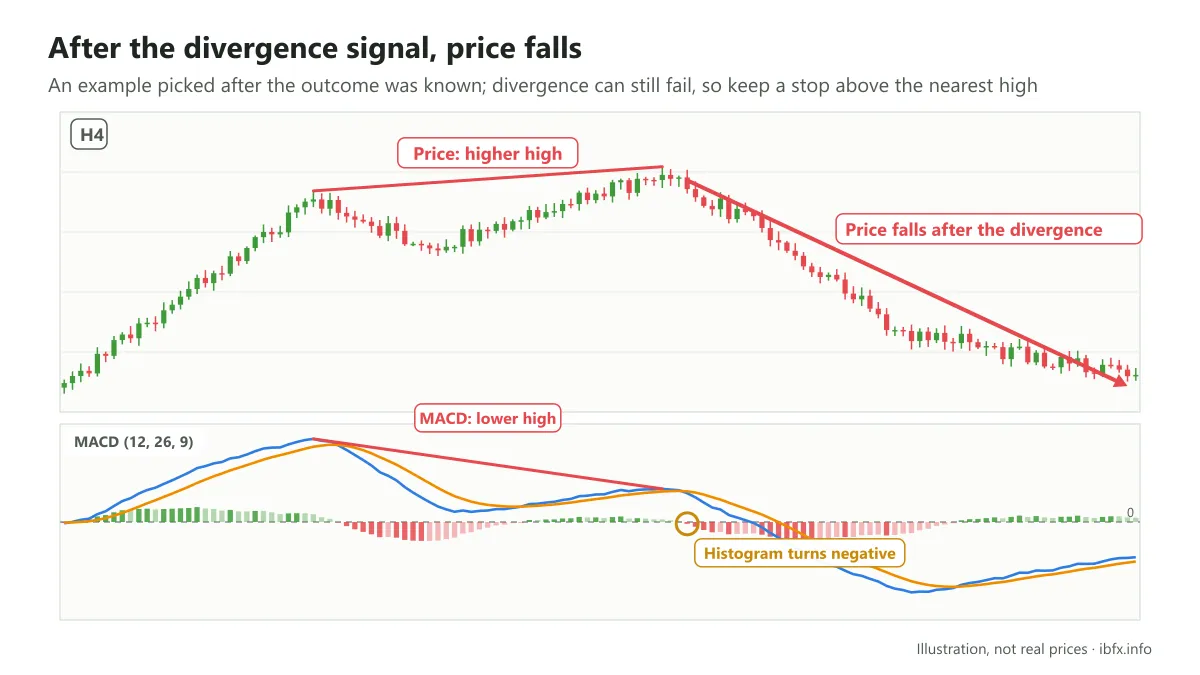
Back to the example above: the divergence that shows up on H4, together with the D timeframe failing to make a higher high, shows that the buyers are weakening. Many traders would consider a Sell here, with the stop above the nearest high, even though the divergence can still fail.
Combining MACD with other indicators and reversal candlestick patterns
Combining the MACD indicator with reversal candlestick patterns
This is a simple approach and one that many traders use with MACD. It is a double combination: divergence and convergence, showing that one of the 2 sides may no longer be keen on pushing price higher or lower.
And at the same moment, candles that signal a reversal appear, which can be a good chance to enter.
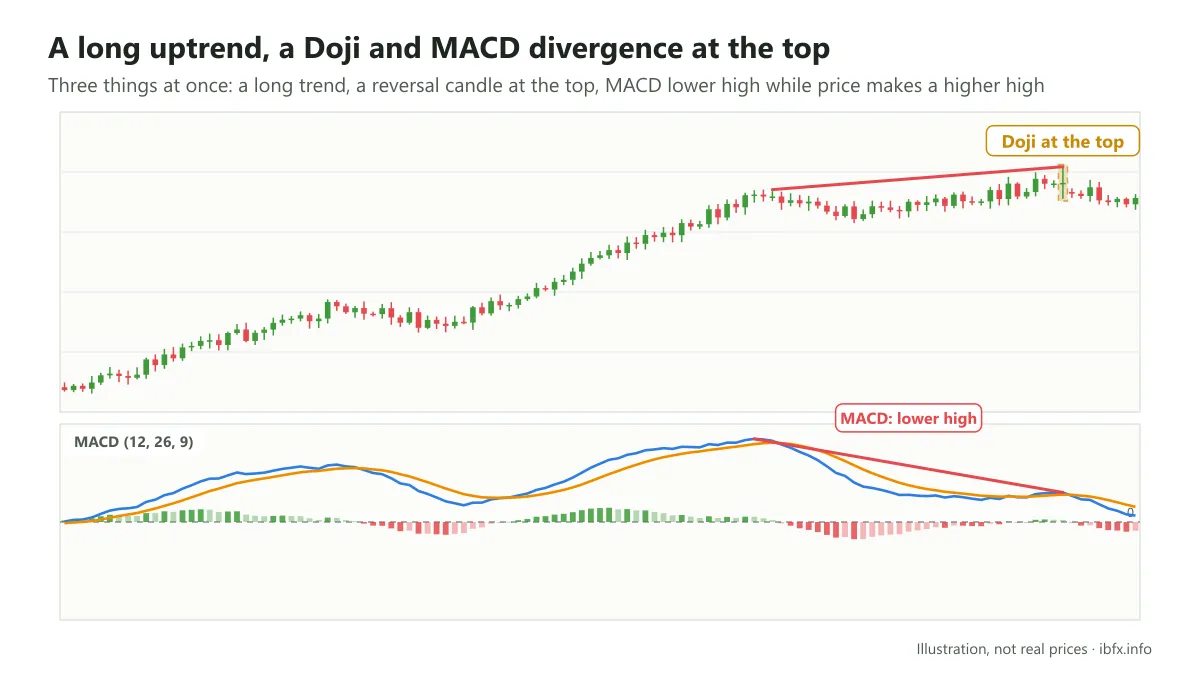
This is the clearest example of using divergence or convergence to find an entry. You can see price has had a very long run up, making higher lows and higher highs one after another.
And if you look carefully you will see that, after the buyers tried to push price up to make a higher high but were overwhelmed by the sellers, the fight between the 2 sides was left almost evenly matched, and so a Doji reversal candle formed.
Together with that, on the daily candle timeframe MACD forms a divergence, which shows the buyers seem to be exhausted and do not want to push price any higher.
So there are 3 things showing you that a SELL could be worth considering:
- The uptrend has run for a long time
- 1 reversal candle appears right at the top.
- The divergence happens at the same moment the doji forms.
And if you enter a SELL with the stop loss placed above the doji, look at what happens:
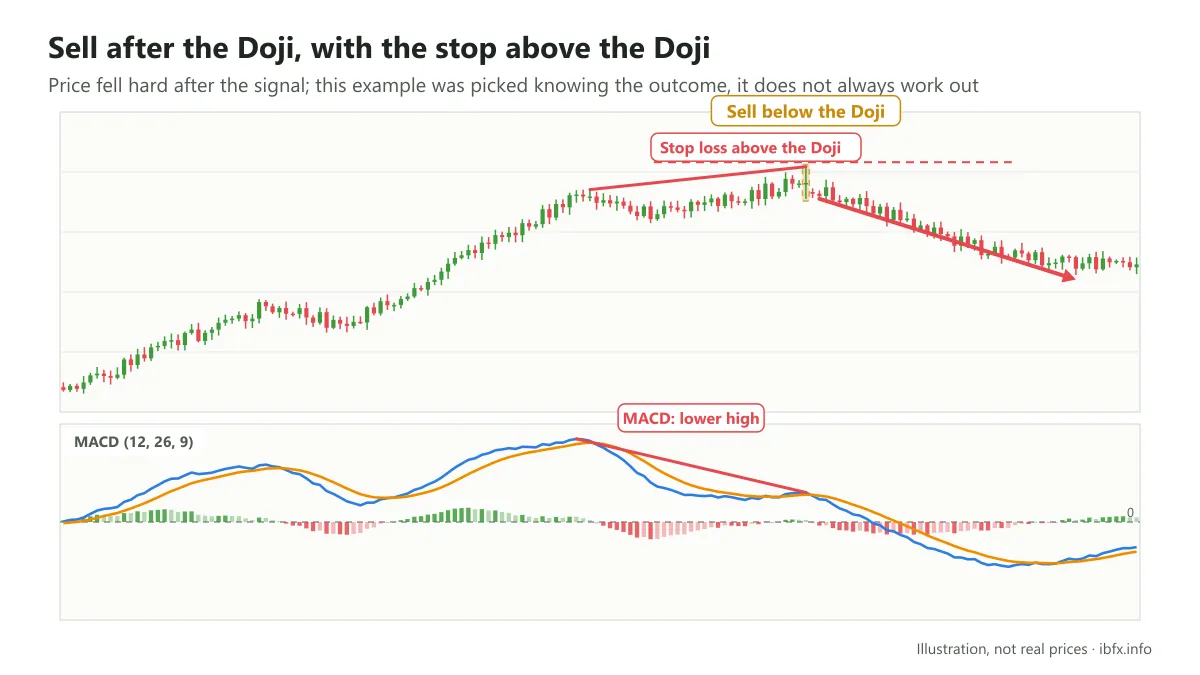
In this example price fell hard from the moment the doji appeared. Combining several things makes the signal more reliable, but this is an example picked after the outcome was known; it does not turn out like this every time.
Combining MACD with other indicators such as Stochastic, RSI…
This is a way of combining 2 momentum indicators at the same time. On top of that, in an earlier article about Stochastic we said that Stochastic is used to compare the closing price of a stock with its price range over a given period, while MACD is built from two moving averages to produce divergence and convergence; that way it helps a trader work out the momentum of price and at the same time find the moment a reversal could happen.
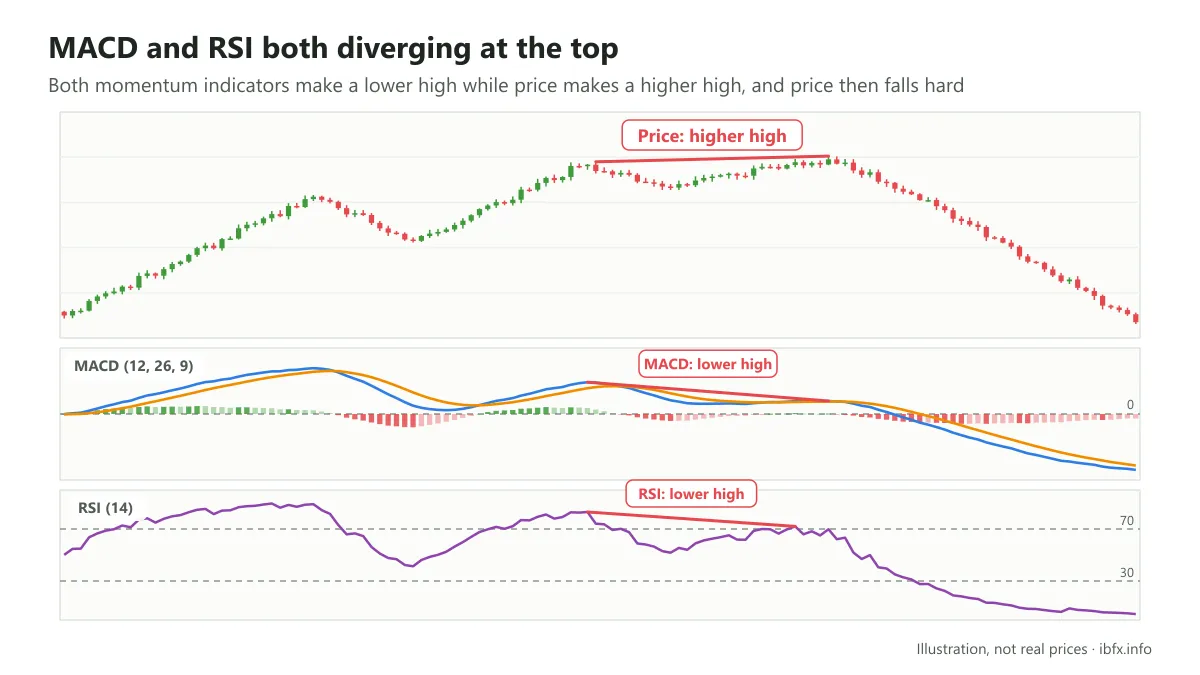
Looking at the picture above, you can see the 2 indicators both give a divergence signal, and price did fall hard after that signal.
That is how we have walked you through the most basic ways to use MACD. Because it is calculated from EMA lines, MACD lags and gives plenty of noisy signals when the market moves sideways, so always place a stop loss when you trade.