On this page
When you trade, a market that has a trend usually gives big waves, but the market does not always have a trend.
So how can you trade when the market has no trend? This article sets out a simple trading system for that stretch, along with the risks you need to know about. If you are new, you should also read the article on what a sideways market is.
What a market with no trend (a sideways market) is
A market with no trend, also called a sideways market, is one with no clear uptrend or downtrend, only a move sideways.
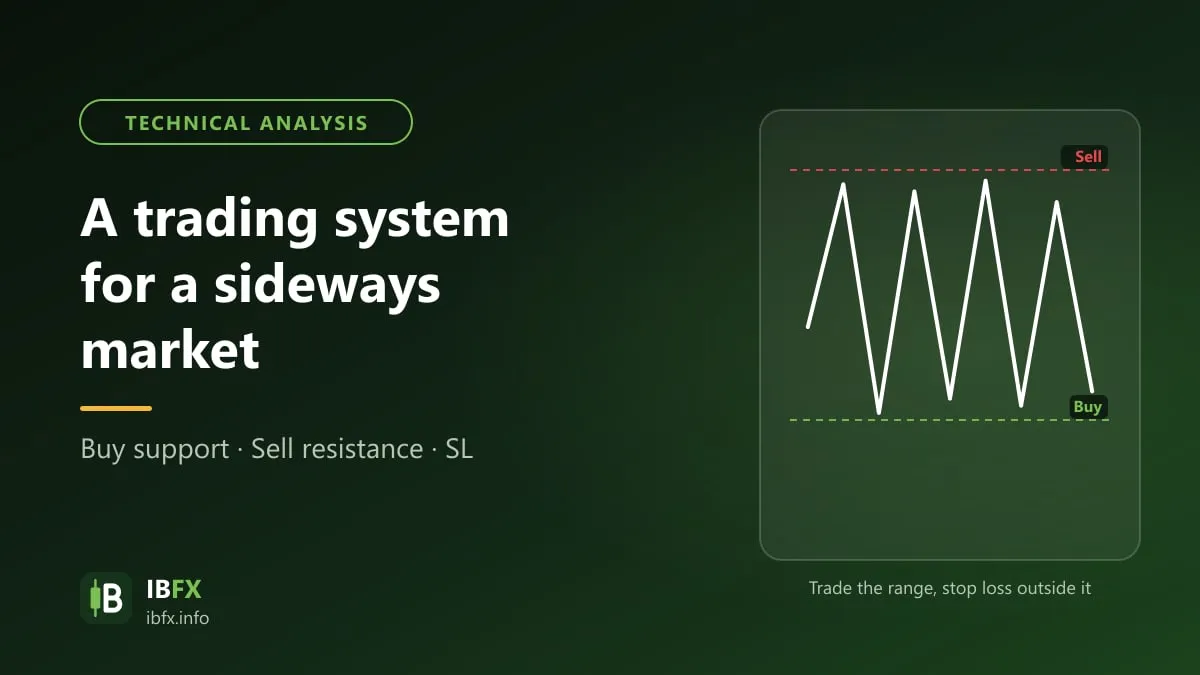
In a sideways market, price only goes up and down inside a horizontal price channel, with 2 lines, a resistance line above and a support line below.
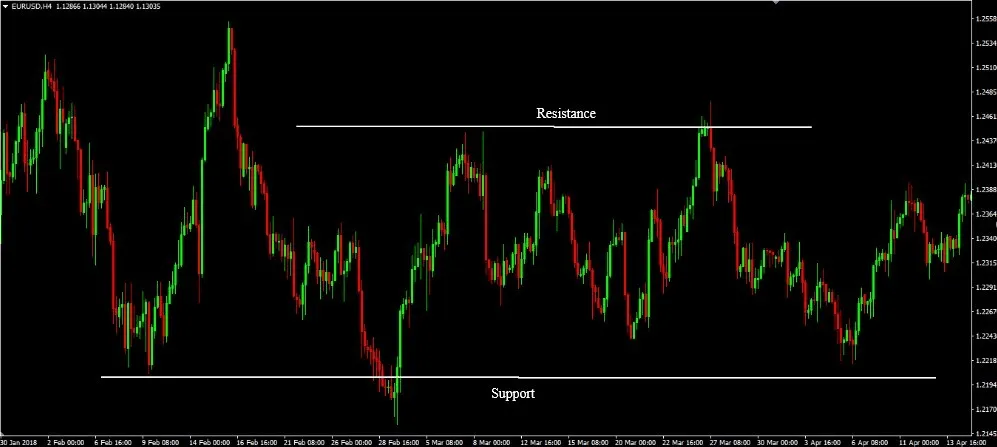
An example of a sideways market.
Working out when the market has no trend
Now that we have defined what a sideways market is, our job is to work out when a sideways market forms and to draw it out so we can find places to trade.
Step 1: Find 2 lows at the same level
Step 2: Join the 2 lows into a Support line
Step 3: Find 2 highs at the same level
Step 4: Join those 2 highs into a Resistance line
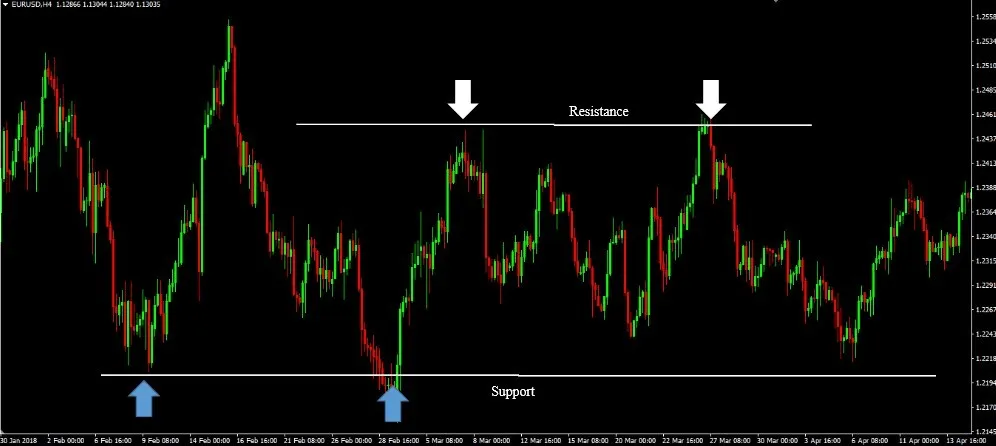
By this point you have a picture of what a trading system in a sideways market looks like, haven’t you?
Now let us go into how to trade a sideways market.
How to trade a market with no trend
And finally we need to set up the trading system for a sideways market.
The idea is fairly simple: when price comes up near the resistance line, look for a chance to sell, and when price comes down near the support line, look for a chance to buy. But you need 3 conditions:
- The sideways zone has to be wide enough: the distance between support and resistance has to be several times larger than the stop loss distance plus costs, otherwise the reward-to-risk ratio will not be worth it.
- Wait for a signal that confirms price is bouncing back (a reversal candle, for example) instead of entering the moment price touches the line.
- Work out the position size from the stop loss distance, so that each trade only risks a small part of the account.
Here is an example of a real case of setting up a BUY order:
Step 1: Find the 2 lines, support and resistance (explained above)
Step 2: Wait for price to come back near the support line
Step 3: When there is a signal that price is bouncing up, enter a BUY order
Step 4: Set the Stop Loss below the support line by enough of a distance to avoid the noise (10-20 pips on a small time frame, for example, and further out on a large one)
Step 5: Set the Take Profit near the resistance line above
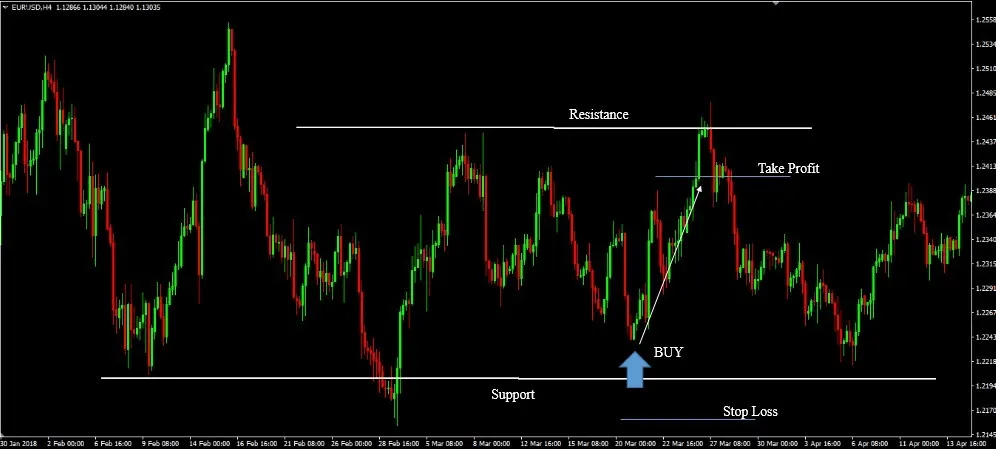
An example of setting up a BUY order.
It works the same way in reverse for a SELL order. Here is an example of a real case of setting up a SELL order:
Step 1: Find the 2 lines, support and resistance (explained above)
Step 2: Wait for price to come up near the resistance line
Step 3: When there is a signal that price is turning back down, enter a SELL order
Step 4: Set the Stop Loss above the resistance line by enough of a distance to avoid the noise (10-20 pips on a small time frame, for example, and further out on a large one)
Step 5: Set the Take Profit near the support line below
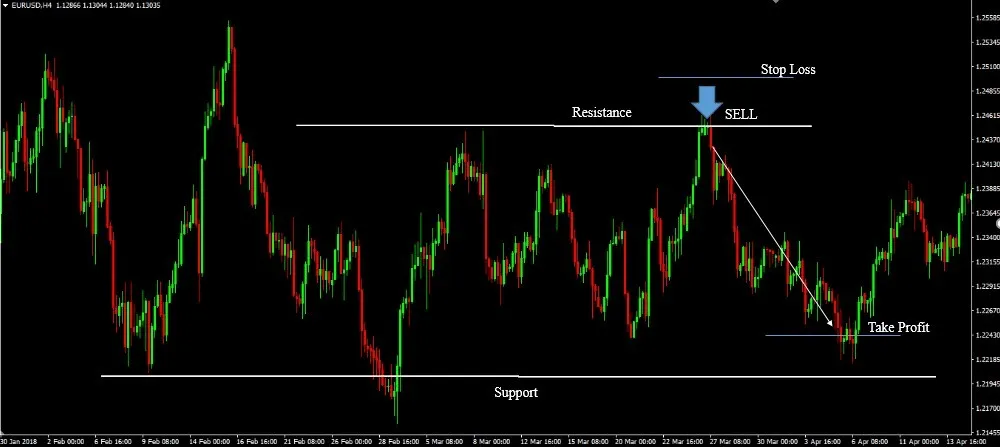
So now we understand what a sideways market is and how to trade it.
The biggest risk in this system is that a sideways zone does not last forever: at some point price will break out of it, and an order placed against the direction of the break will be stopped out. Once price has clearly closed outside the zone, stop trading the old zone. The other way round, there are also false breaks, after which price comes back into the zone.
One more thing I always remind people of is to keep an eye on the economic calendar so you can catch the economic events that can cause a hard move in a very short space of time, because news is usually what makes price break out of a sideways zone.