On this page
If you follow technical analysis, you have almost certainly come across RSI. RSI is a momentum indicator (it measures the speed and size of price changes), it gives overbought and oversold signals as well as divergence and convergence between price and the indicator, and it is usually used to look for a possible reversal.
Among the technical indicators used on the financial markets there is one with much the same job as RSI, but with volume added to it instead of nothing but the closing price: the Money Flow Index (MFI). Bringing volume into the calculation lets MFI reflect the idea that “volume drives price”, which suits the analysts who trade on that principle.
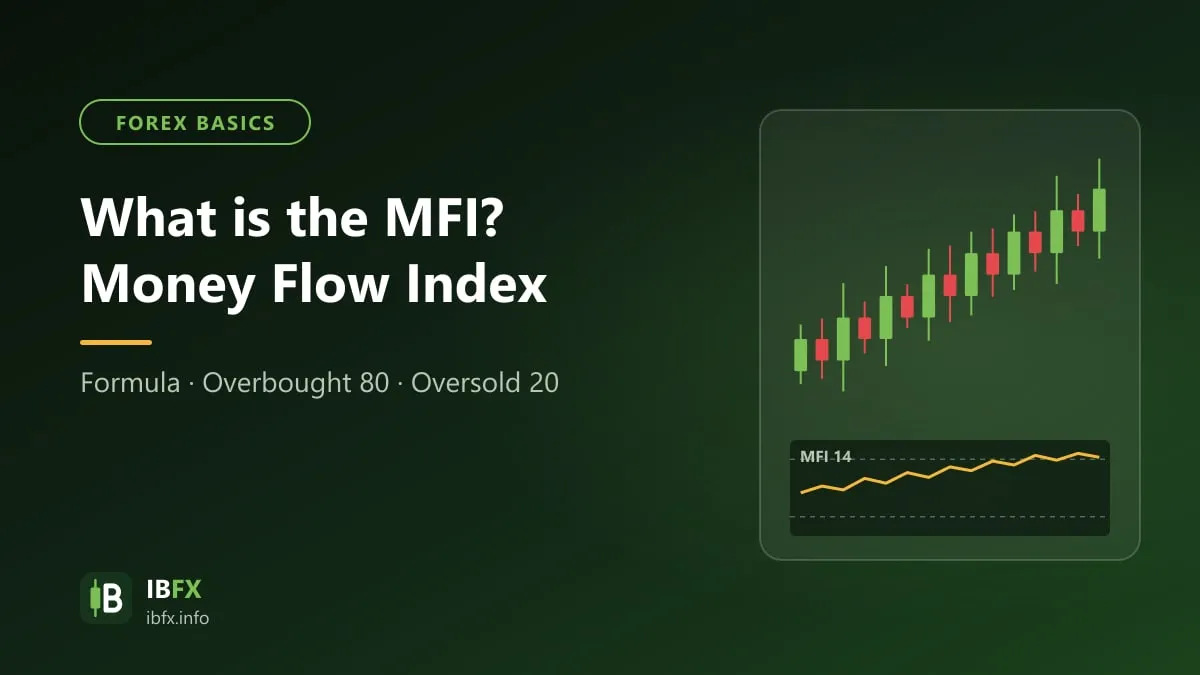
What is MFI? The formula, what it means and how to use the MFI indicator are the main things this article sets out to share with you.
What is MFI?
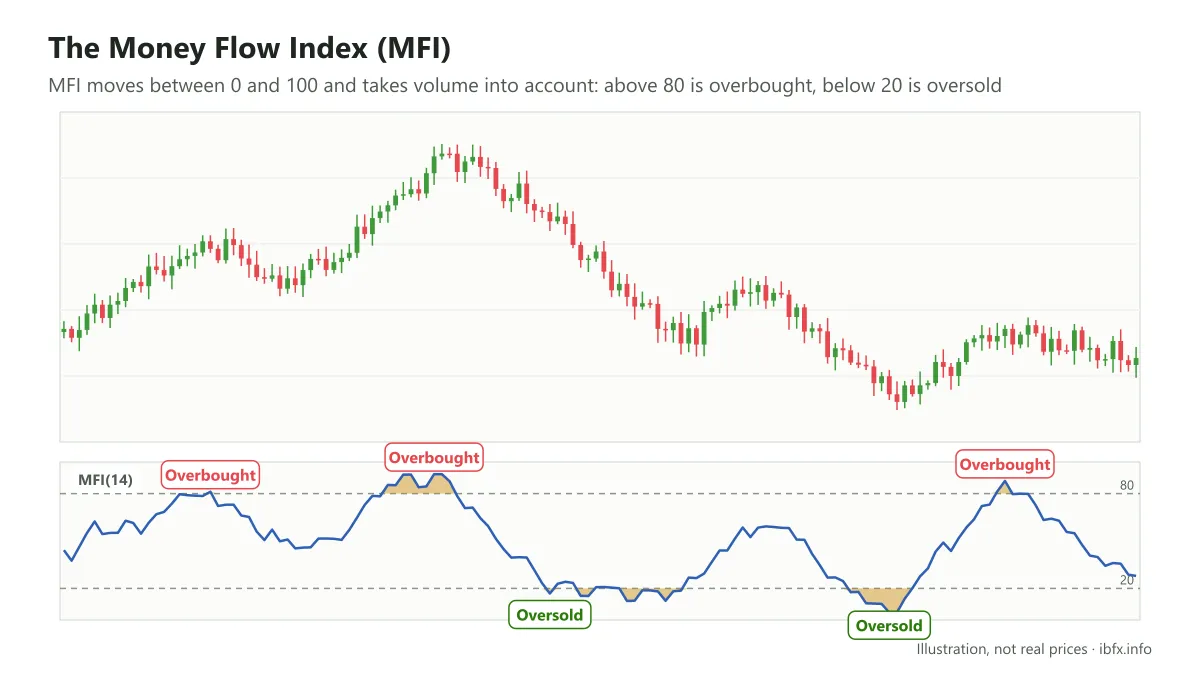
The Money Flow Index (MFI), the money flow indicator, is an oscillator whose value runs from 0 to 100 and which gives a trader 3 main trading signals: overbought and oversold, divergence and convergence, and the direction of the trend. Of those, the trend-reading part of MFI does not work as well as most other trend indicators, so traders very rarely trade on that particular signal. The other 2 are used far more often.
MFI was developed by Gene Quong and Avrum Soudack. Because it builds on the properties of RSI with volume added, MFI is also called the volume-weighted RSI. The two authors found that when the market makes a top or a bottom, volume rises at that point, so technical indicators built on price changes alone cannot reflect the whole picture of the market. That is why they added volume, to make RSI more complete. It is also why trading software files MFI under the volume indicators.
A note for forex: the foreign exchange market has no central exchange, so there is no overall trading volume. MFI on MT4 uses tick volume (the number of times the price changed) at your own broker, so the MFI value can differ from one broker to another and the “money flow” element is only an approximation.
How is MFI calculated?
Where the values of RSI depend on the closing price alone and the formula is fairly simple, MFI depends on the closing price, the high and the low, and of course on trading volume as well; on top of that, working out a single MFI value takes several separate steps.
- The MFI formula:
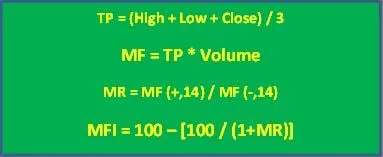
Step 1: work out the typical price
TP = (High + Low + Close) / 3
Step 2: work out the money flow
MF = TP * Volume
MF is positive money flow MF(+) if the typical price TP of the current period is higher than the TP of the period before it. The other way round, MF is negative money flow MF(-) if TP is lower than the TP of the period before it.
Step 3: work out the money ratio
MR = MF (+,14) / MF (-,14)
Step 4: work out the value of the MFI indicator
MFI = 100 – [100 / (1+MR)]
Where:
- High, Low, Close: the high, the low and the closing price of each trading period in the cycle.
- Volume: the trading volume of each period in the cycle
- MF (+,14): the sum of positive money flow over 14 periods, MF (-,14): the sum of negative money flow over 14 periods.
The number 14 is the period the authors suggested for this indicator. Depending on the strategy and the timeframe, though, traders can change the period to suit the way they trade.
What MFI looks like and what it means
Before going into what the MFI indicator means, take another look at the formula:
- MFI moves between the 0 line and the 100 line
- MFI moves toward 0 as MR falls toward 0, that is, as MF (+,14) becomes very small compared with MF (-,14). That means the money flow (price times volume) of the falling periods is far larger than that of the rising periods, selling pressure is higher, and the sellers have the upper hand.
- MFI rises toward the 100 line as MR heads toward infinity, that is, as MF (-,14) becomes very small compared with MF (+,14). That means the money flow of the rising periods is far larger than that of the falling periods, buying pressure is higher, and the buyers have the upper hand.
- MFI = 0 or MFI = 100 means that across all 14 trading periods in the cycle you are looking at, the typical price TP = (high + low + close)/3 fell period after period with not a single rise, or rose period after period with not a single fall; at that point the market is oversold or overbought and may be about to turn, although in a strong trend the indicator can stay in that zone for quite a while.
- In practice MFI very rarely comes close to 0 or to 100, so traders usually pick the 80 and 20 lines as the overbought and oversold levels when they trade with this indicator. The closer to the 0 and 100 lines you set them, the rarer the oversold and overbought signals become, but even once a signal does appear price can still carry on in the same direction, so you need a further confirming signal.
How to set up the MFI indicator on MT4
To put MFI on a chart in the MT4 trading platform, follow this path: Insert → Indicators → Volumes → Money Flow Index.
The settings dialog appears as below:
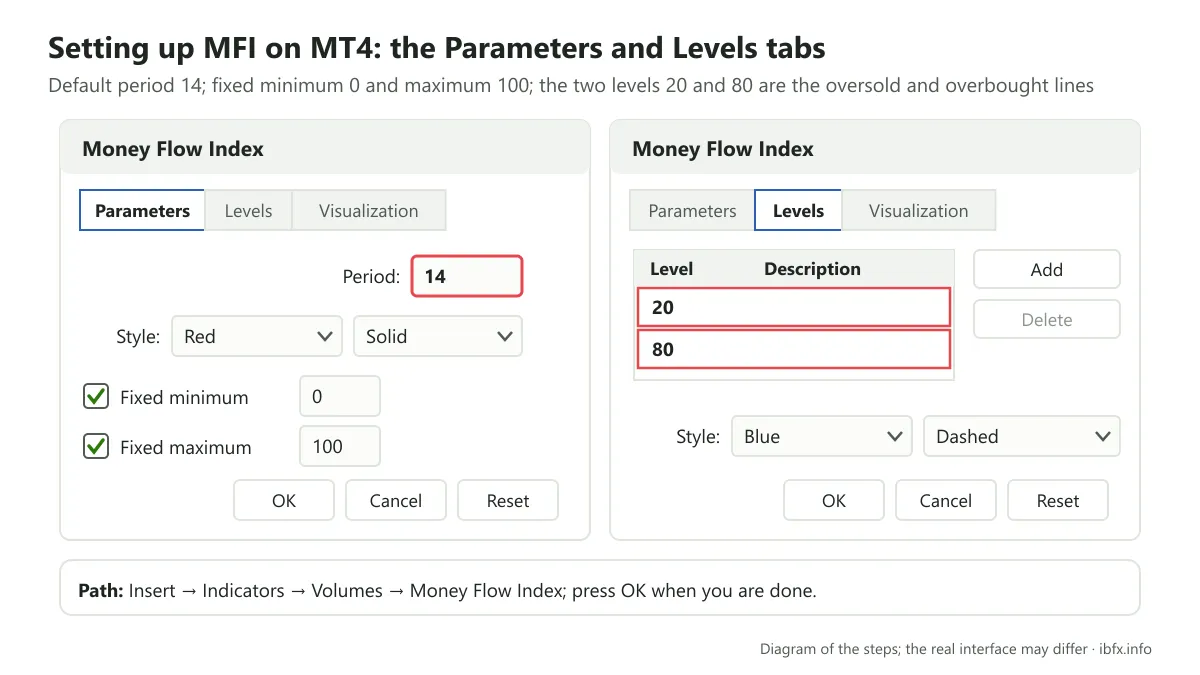
- On the Parameters tab: pick the period for the indicator. The default is 14, and you can change it to suit your own strategy. Pick the color, the style and the thickness of the indicator line. Then tick the two boxes Fixed minimum and Fixed maximum to fix the upper and lower boundary values.
- On the Levels tab: the system sets 20 and 80 as the oversold and overbought thresholds. Here you can change those values by double-clicking each value shown in the Level column and editing it. Or you can add and remove other values with the Add and Delete buttons. Then pick the color and thickness of those lines.
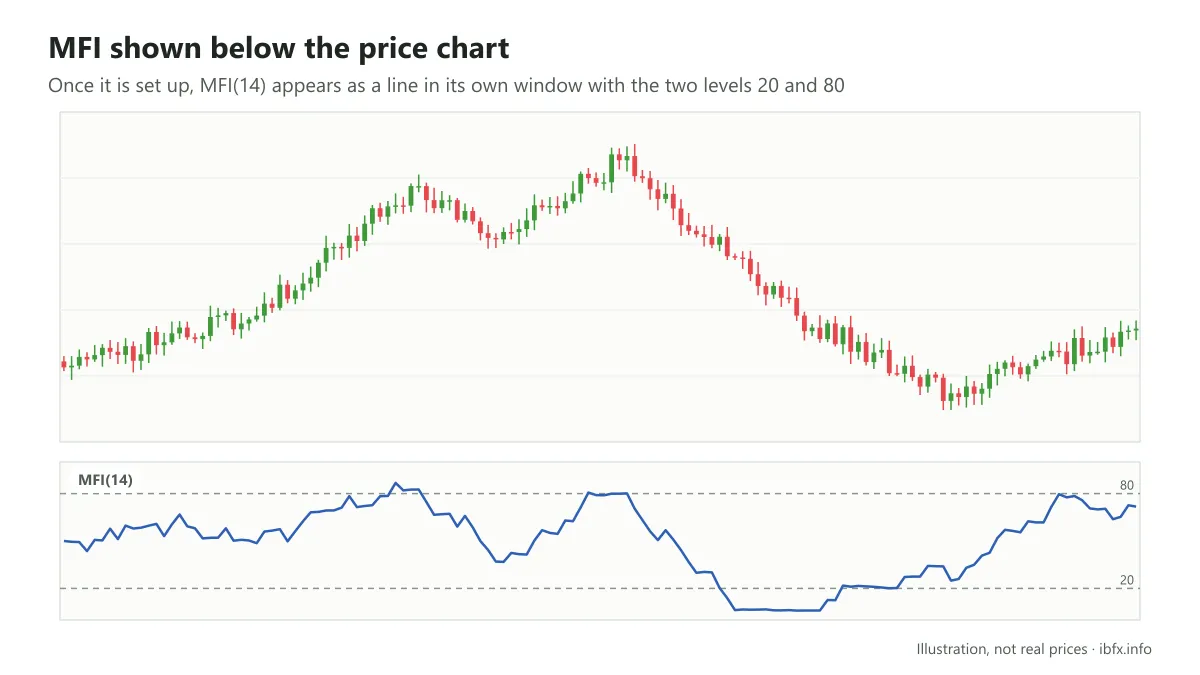
Once you are done, press OK to finish. The MFI indicator then appears as a line chart in its own window just below the price chart, like this:
How to use the MFI indicator in forex trading
As said at the start, the MFI indicator gives 3 trading signals: the direction of the trend, oversold and overbought, and divergence and convergence. In this part we go through how to use MFI with all 3 of them.
Reading the market trend with MFI
To read the market trend with MFI, you can add the 50 line, or the 45 and 55 lines, in much the same way as you would with RSI.
- If MFI stays above the 50 line, the market is in an uptrend.
- If MFI stays below the 50 line, the market is in a downtrend.
Example:
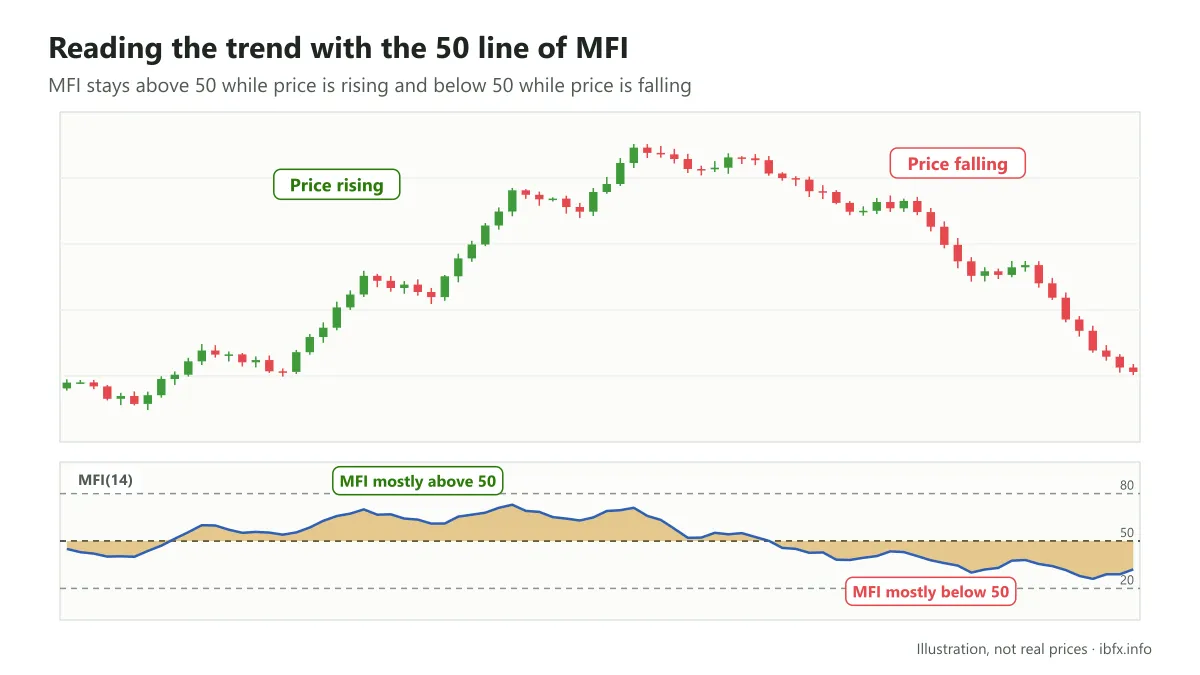
You can also use this signal with the 45 and 55 lines instead of 50 to read the trend. That is:
- If MFI stays above the 55 line, the market is in an uptrend
- If MFI stays below the 45 line, the market is in a downtrend
Example:
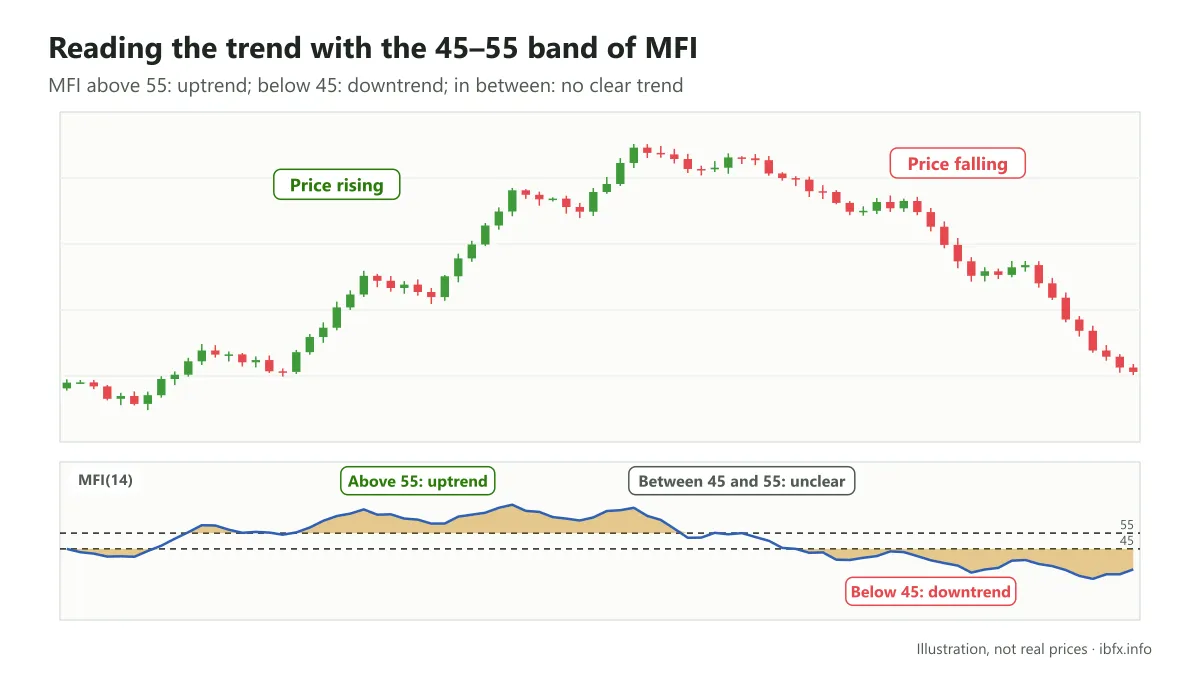
The overbought and oversold signals
- The market gives an OVERBOUGHT signal when MFI rises above the 80 line. Overbought is a warning that the market may turn down; it is not yet a signal to enter a Sell.
- The market gives an OVERSOLD signal when MFI falls below the 20 line. Oversold is a warning that the market may turn up; it is not yet a signal to enter a Buy.
The way to trade it is as follows:
- A Buy signal comes when MFI leaves the oversold zone and crosses above the 20 line. Enter as MFI crosses above 20, or after a bullish candle on the price chart has confirmed it.
- A Sell signal comes when MFI leaves the overbought zone and crosses below the 80 line. In the same way, enter as MFI crosses below 80, or wait for a bearish candle on the price chart to confirm it.
Example:
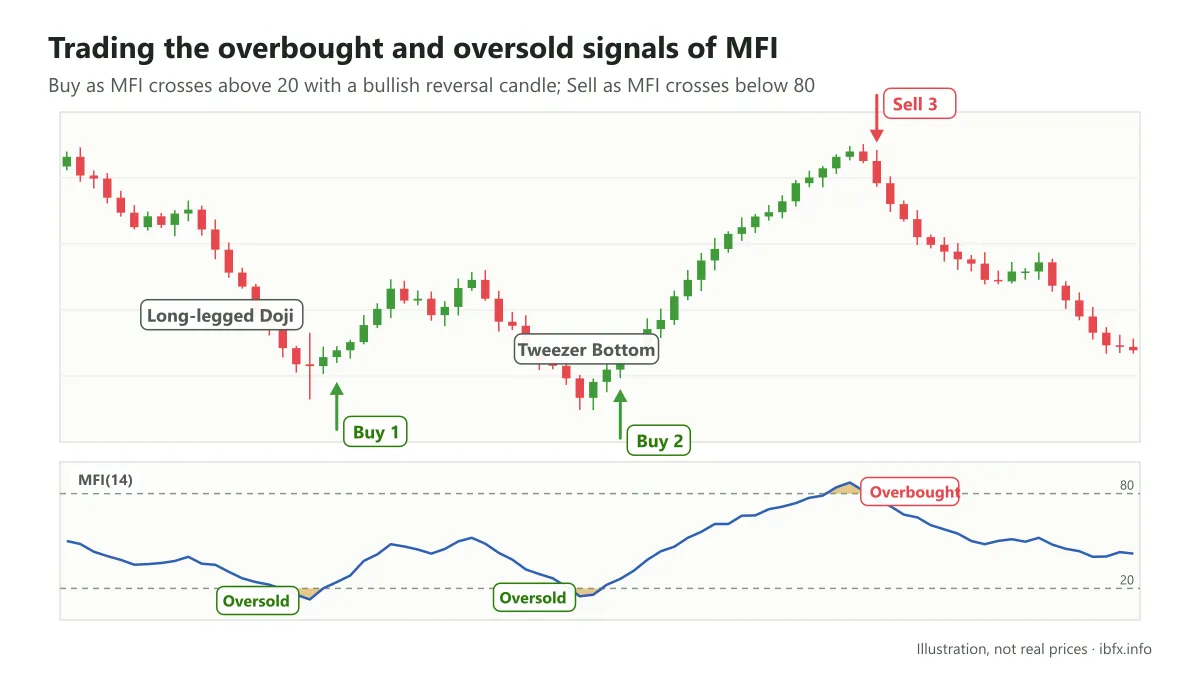
At the first Buy, price forms a long-legged Doji, which suggests price is likely to break out one way or the other, up or down sharply; and because it appears after a long downtrend, price may well turn up. At the same moment MFI moves into the oversold zone, which raises the chance of a reversal. All you then do is wait for MFI to cross above the 20 line and enter a Buy.
The same goes for the second Buy: the bullish reversal pattern Tweezer Bottom appearing while MFI is in the oversold zone makes a turn in price that much more likely.
At the third trade, a Sell, it would be hard to find any signal other than MFI moving into the overbought zone if you did not look at the wider picture. Zoom the price chart out, though, and you will see the market is in a long-term downtrend:
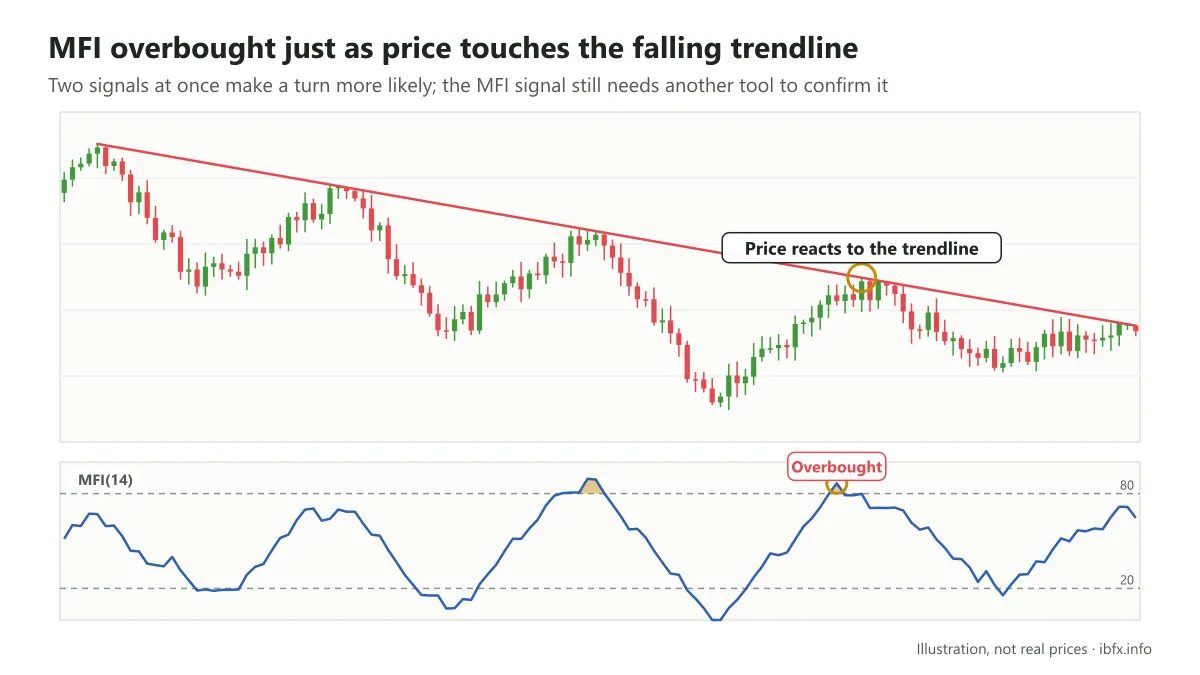
As price touches the trendline of the downtrend, MFI moves into the overbought zone, which strengthens the signal that price will turn back down.
What all 3 cases have in common is that we used other tools to confirm the MFI signal, for the simple reason that these signals are not always right.
Example: MFI moves into the overbought or oversold zone but the market does not turn.
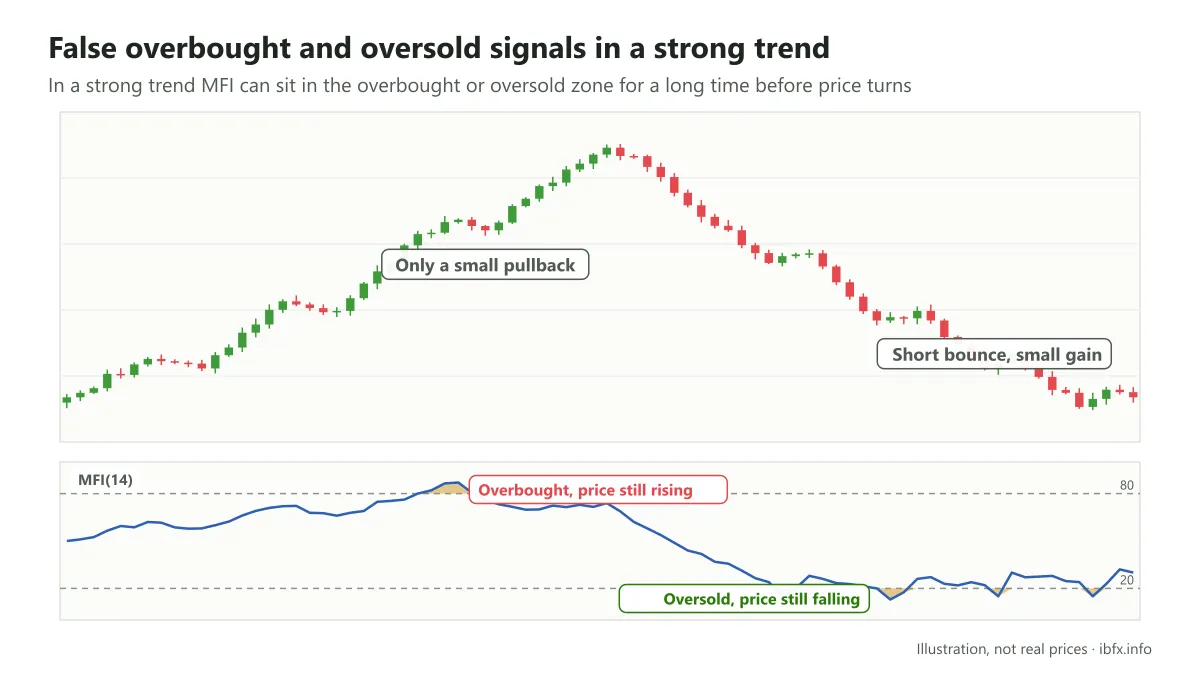
MFI moves into the overbought zone but price keeps rising. Price does fall right after MFI crosses below the 80 line, but only in a very small pullback.
In the same way, MFI moves into the oversold zone but price keeps falling; these oversold signals are nothing more than very small rallies inside a large downtrend. Only the third oversold signal is followed by a turn up in price, and it lasts a very short time and does not go far, so the trade is not worthwhile because of the poor risk-reward ratio.
- How to trade the overbought and oversold signals well
In practice the overbought and oversold signals of MFI come up very often and are not always right, as in the example above. That is why, besides combining them with other analysis tools, we need to watch how MFI moves after it leaves those overbought and oversold zones.
In detail:
- First, spot MFI leaving the overbought zone (crossing below the 80 line) or leaving the oversold zone (crossing above the 20 line).
- Watch how MFI moves: usually MFI will retest the 20 or 80 line before it leaves the oversold or overbought zone for good.
- For an oversold signal: after crossing above the 20 line, MFI moves around near the 20 line but does not go back into the oversold zone.
- For an overbought signal: after crossing below the 80 line, MFI moves around near the 80 line but does not go back into the overbought zone.
- Entering: enter a Buy as soon as MFI rises and breaks the nearest high before it, ending the retest. Enter a Sell as soon as MFI falls and breaks the nearest low before it, ending the retest.
Example:
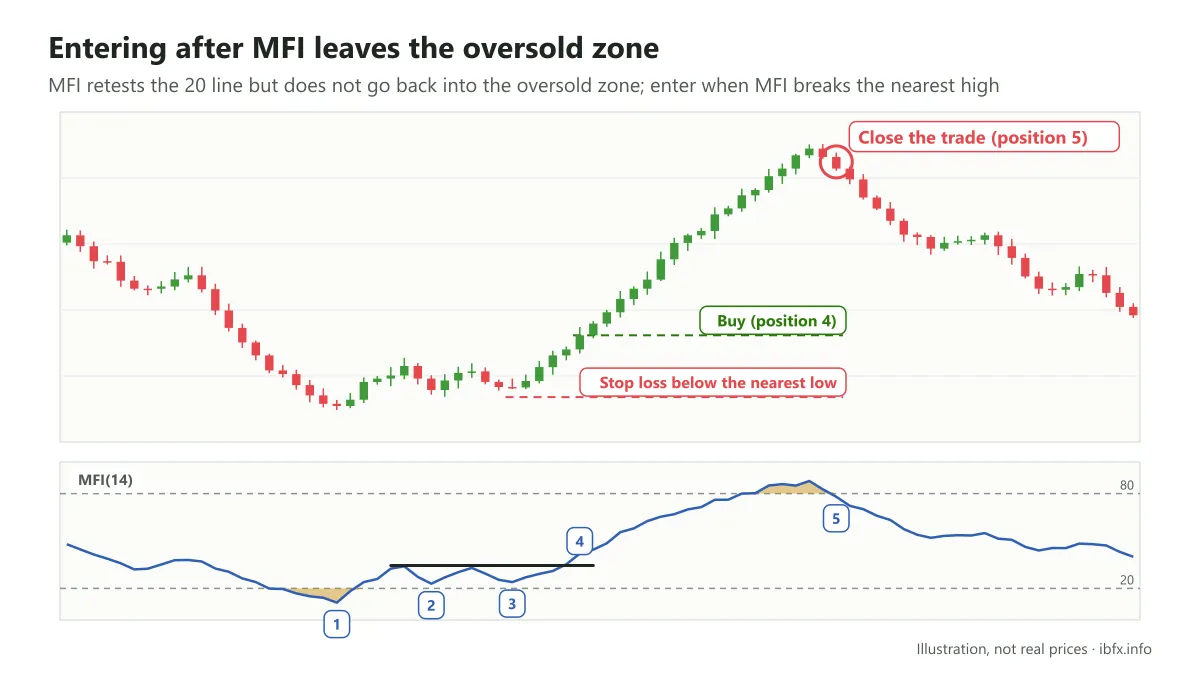
- Position 1: MFI moves into the oversold zone
- It then crosses above the 20 line to leave the zone and moves around the 20 line.
- There are 2 rounds where MFI retests the 20 line but does not go back into the oversold zone (positions 2 and 3)
- Position 4 is where MFI rises and breaks the nearest high before it (which is also resistance on MFI in this case).
- Enter at position 4, with the stop loss below the nearest low on the price chart
- Take profit as MFI crosses below the 80 line (position 5)
Example:
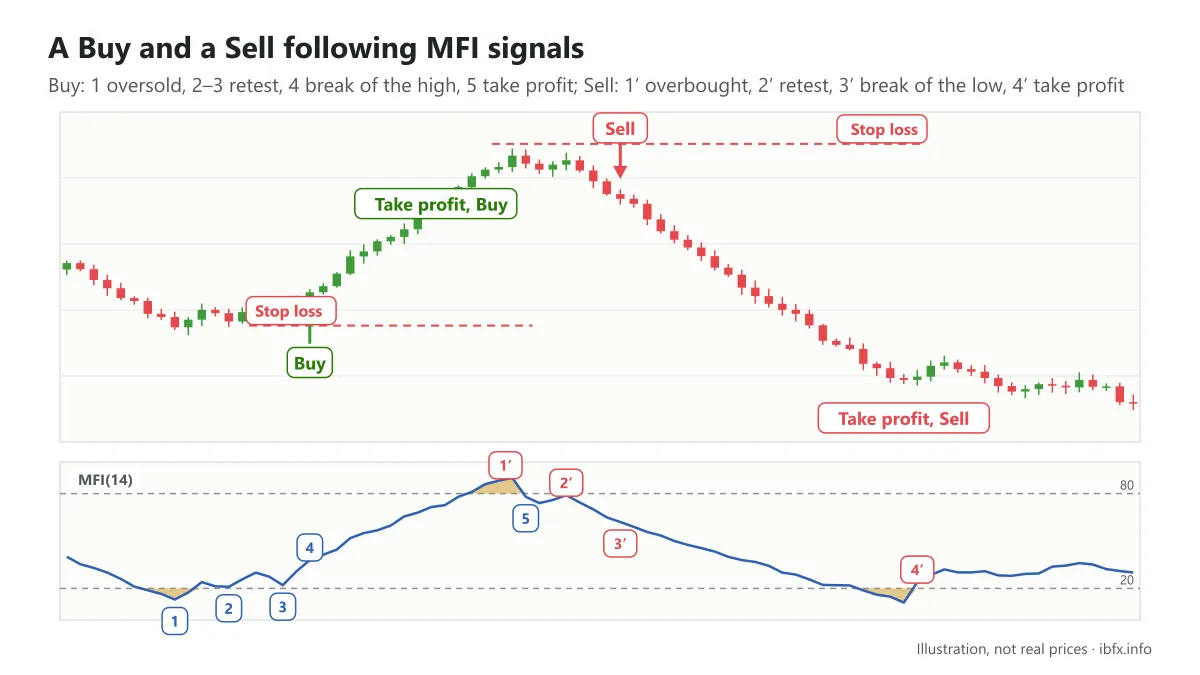
The way MFI behaves for the Buy in this case is much like the Buy in the example above:
- Position 1: MFI moves into the oversold zone
- Positions 2 and 3: MFI retests the 20 line but does not go back into the oversold zone
- Position 4: MFI rises and breaks the nearest high before it.
- Enter a Buy at position 4 and close the trade at position 5, as MFI crosses below the 80 line.
The Sell:
- At position 1’, MFI moves into the overbought zone.
- MFI then retests that overbought threshold once more at position 2’ but does not cross back above it.
- Enter a Sell as soon as MFI falls and breaks the nearest low before it, at position 3’.
- Put the stop loss above the high of the uptrend and close the trade to take profit at position 4’, as MFI crosses above the 20 line.
The divergence and convergence signals
- Divergence is when price makes a higher high but MFI makes a lower high. Price making a higher high means the market is still in an uptrend, but MFI making a lower high shows the push behind the rise has weakened and the market may turn down.
- Convergence is when price makes a lower low but MFI makes a higher low → the market may turn up.
Divergence and convergence between MFI and price only tell us the market may rise or fall, which helps a trader pick a direction but does not point to an entry or an exit. To trade this signal well, then, you need to bring in other tools such as candlestick patterns, chart patterns or other technical indicators to work out sensible entry and exit points.
Example:
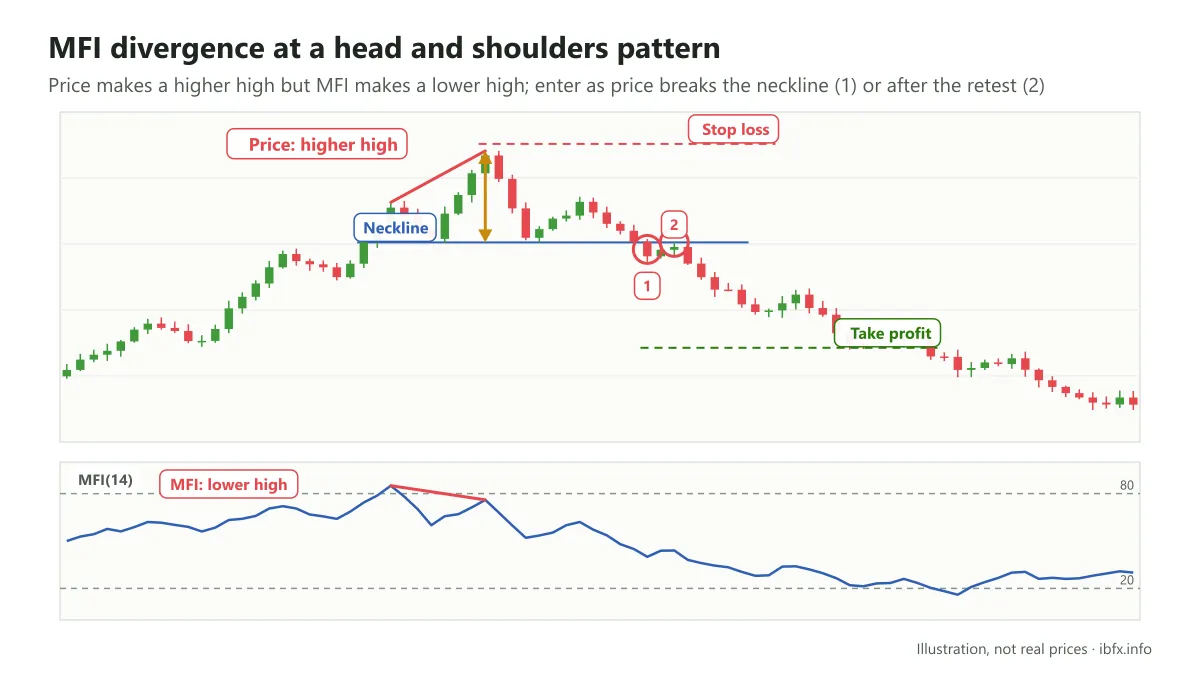
In this case a divergence appears, signaling that price may turn down. Looking at the price chart at that moment, we see price forming a head and shoulders pattern, a very common bearish reversal pattern in forex.
Draw the neckline of the pattern to work out the entry. You can enter as price breaks the neckline (position 1) or after the retest (position 2).
Put the stop loss above the head of the pattern. Take profit by the pattern: the take profit point sits away from the entry by the same distance as the height from the head to the neckline. Or take profit on the MFI signal: close the trade as MFI crosses above the 20 line.
Example:
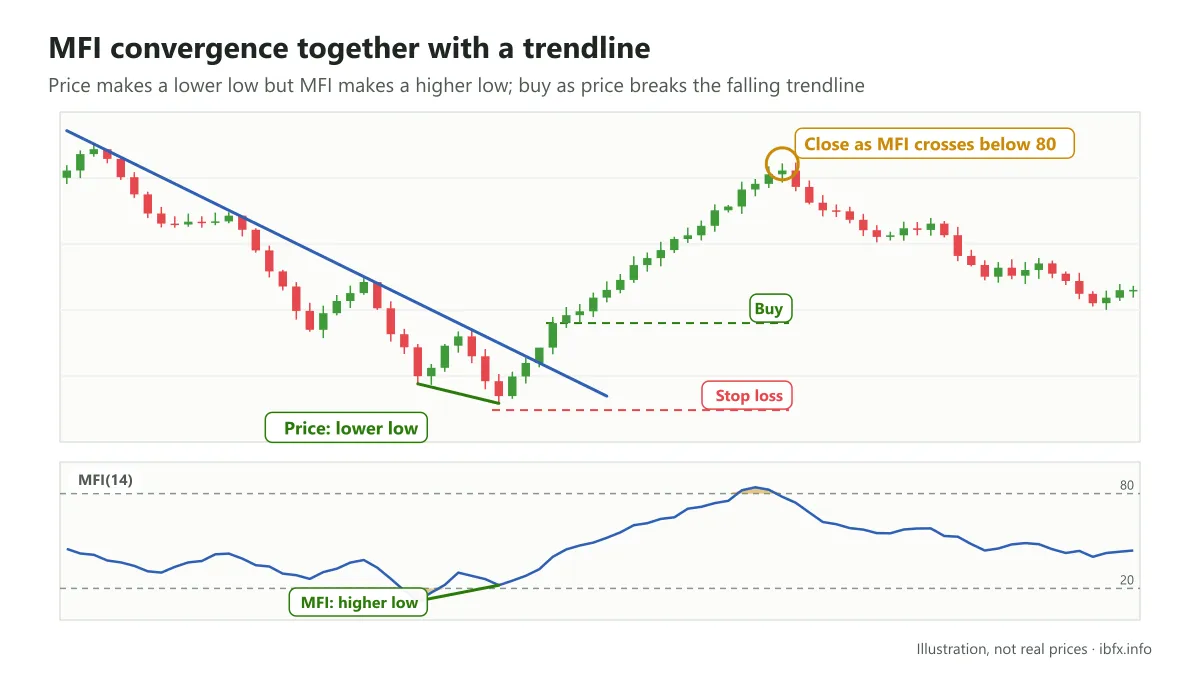
This is a case where we can bring in the trendline of the trend to work out the entry when trading divergence and convergence between MFI and price.
The convergence between MFI and price appears at the same moment as MFI leaves the oversold zone, which makes a turn up in price more likely.
In this case we have 2 ways to work out the entry.
- Way 1: use the oversold signal of MFI. Here you follow the same trading steps as in the examples above. Enter as MFI breaks the nearest high before it, after the retest of the 20 line.
- Way 2: use the trendline to work out the entry. Draw the trendline of the downtrend and enter as price breaks that trendline and moves up.
As you can see, both ways give the same entry. Close the position as MFI crosses below the 80 line.
Keep in mind: divergence and convergence can get a trader into a trade early when the trend turns, but these signals do not always come good, and just like the overbought and oversold signals, there will be times when things do not go to plan.
Example: a convergence signal appears but price keeps falling
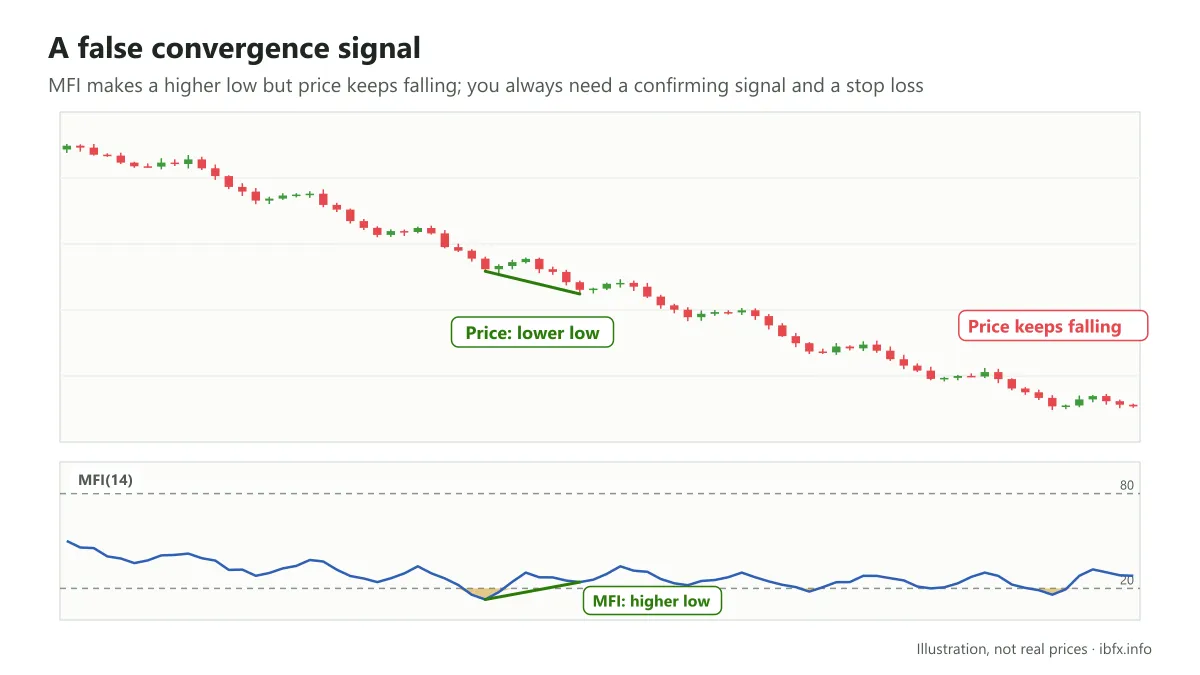
MFI is not a complete trading system, and using the signals from this indicator on their own to trade will not get you far. The more tools you combine, and the more of them that point the same way, the better the odds of a trade working out.
That said, using a lot of analysis tools on the same chart makes it hard to read and messy, which does not suit someone just starting out. So for each indicator, pick just 1 or 2 other tools that work well with it.
We hope that what we have shared in this article gives you a grasp of how to trade with MFI, a variant of RSI with volume added. The above is not everything there is to the MFI indicator, but it is a base to start from. Practice with MFI on a demo account, combine it with a couple of other tools and always place a stop loss; no indicator is a “holy grail”.