On this page
A timeframe is the term for the time span of each candle on a price chart, used in every financial market: forex, stocks, cryptocurrency and so on. Every trader can pick any timeframe to analyze and trade on, depending on their own style and strategy.
Because it is such a basic term that everybody knows in forex, a new trader who starts looking into what a timeframe is will usually be in a rush to find the timeframe that suits their strategy and trading style, while skipping the part where you look into the timeframes thoroughly. The most important thing when you study timeframes is understanding what each candle on each timeframe means; that makes reading candles across timeframes more accurate, and it also shows you how to combine several timeframes in your analysis so that your trading works as well as it can.
What is a timeframe?
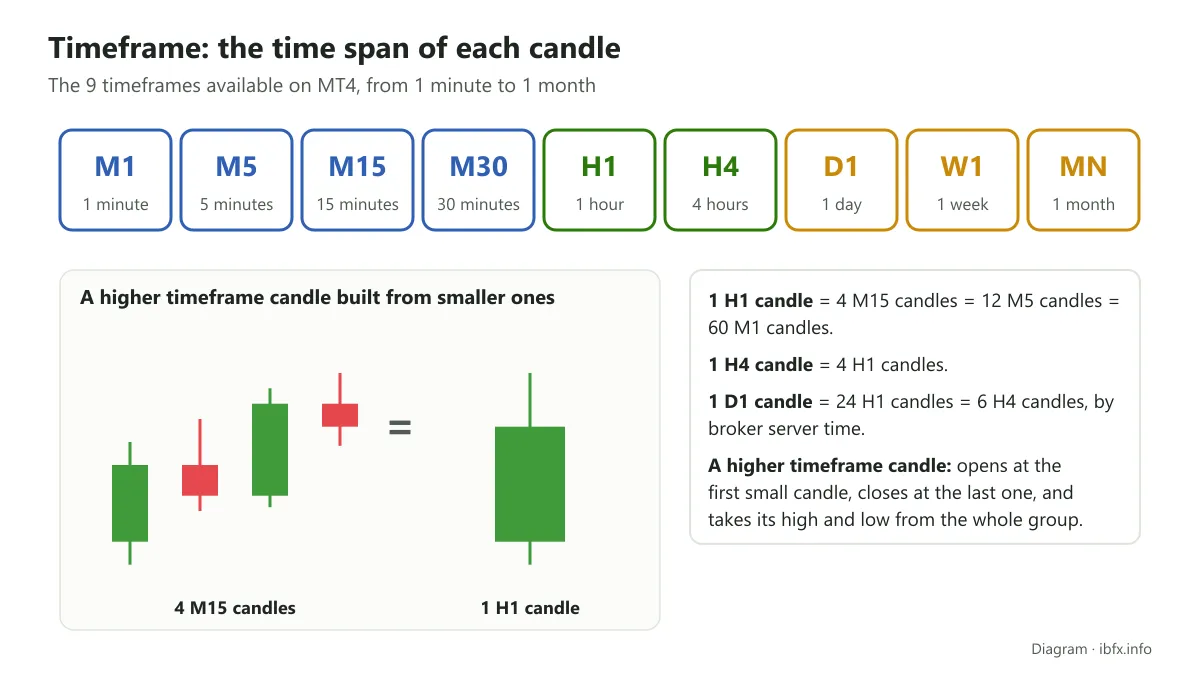
A timeframe is the span of time over which one candle moves within a trading session, meaning each candle forms and swings up and down over a set span of time, and when that span is over another new candle forms.
In forex there are a great many different timeframes, from a few seconds (on some platforms) to 1 month or longer. On the 1 minute timeframe each candle shows how price moved over 1 minute, and after every minute another candle forms. In the same way, on the 1 day timeframe each candle lasts 1 day (from 00:00 to 23:59 broker server time).
Note: most brokers set the MT4 server clock to GMT+2 (winter) or GMT+3 (summer), so the daily candle usually opens at 22:00 UTC (winter) or 21:00 UTC (summer), not at 00:00 UTC. That is why the D1 candle can look slightly different from one broker or platform to another.
The common timeframes and what a timeframe means in forex
On the MT4 platform there are 9 timeframes in all, and these are also the most common timeframes in forex trading.
- M1: the 1 minute timeframe (M standing for Minute)
- M5: the 5 minute timeframe
- M15: the 15 minute timeframe
- M30: the 30 minute timeframe
- H1: the 1 hour timeframe (H standing for Hour)
- H4: the 4 hour timeframe
- D1: the 1 day timeframe (D standing for Day)
- W1: the 1 week timeframe (W standing for Week)
- MN: the 1 month timeframe (MN standing for Month)
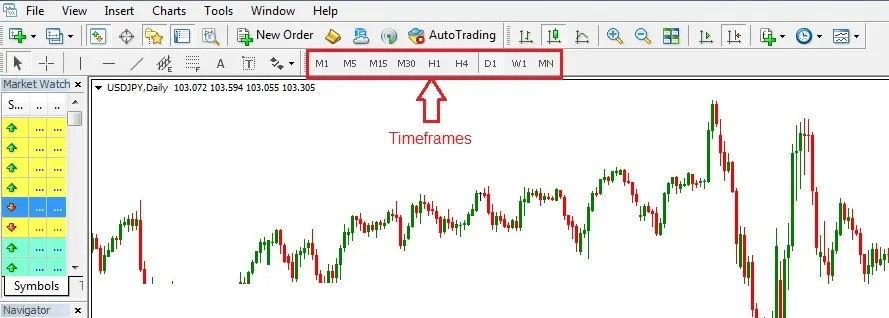
- What a timeframe means in forex trading
A timeframe tells traders how long one candle or one trading session runs, and what the open, high, low and close of the asset were over that span.
For example: the H1 timeframe of the EUR/USD pair. Looking at the price chart on this timeframe, we know the following:
- For candles in the past, each candle covers one hour. If you pick any one hour, say 14:00 - 14:59, you will know which candle belongs to that hour, whether price moved up or down, and over that hour what the highest price was, what the lowest was, what price it opened at and what price it closed at.
- Suppose you are looking at the current candle at 15:20; that means this candle started forming at 15:00 and will end at 15:59. The open is the price set at 15:00, and the close will be set at 15:59. The high and the low are not known until the candle ends.
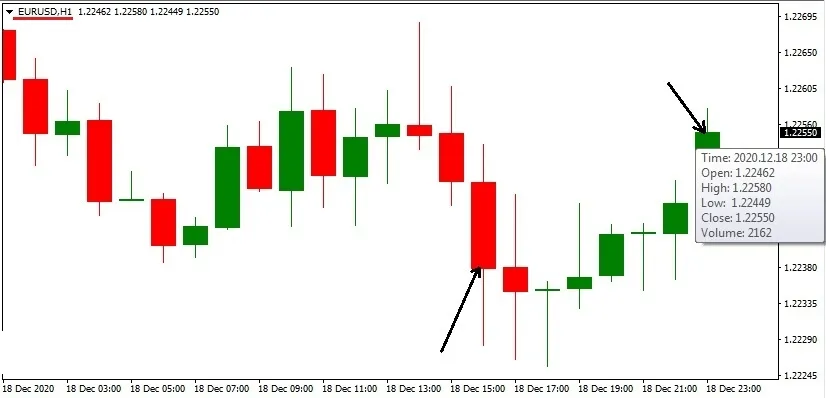
The picture above is the price chart of the EUR/USD pair on the H1 timeframe. Using the horizontal time axis below to work out which candle belongs to which span of time would be very hard, so all you have to do is put the cursor on the High of a rising candle (green) or on the Low of a falling candle (red) and all the trading information for that candle appears as in the picture, including the time (the start time of the candle), the Open, High, Low and Close, and the trading Volume as well.
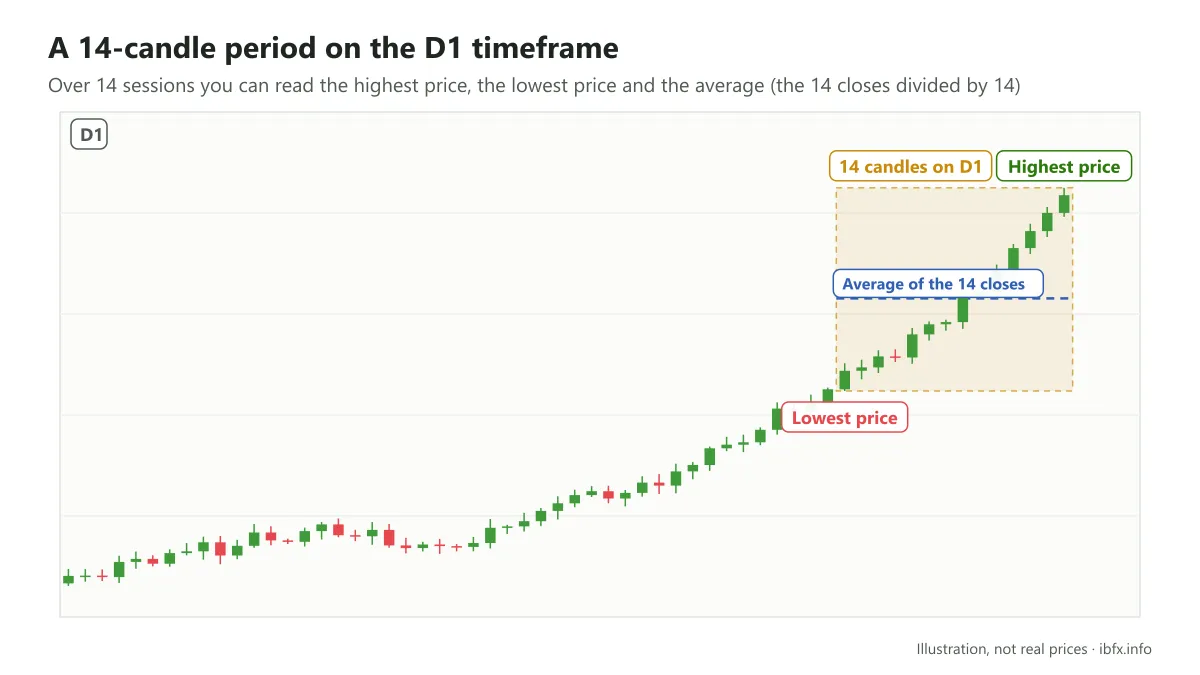
- Besides working out how much price moved within one timeframe, we can also work out how much it moved over a period of that timeframe. Suppose you use the H1 timeframe: then we have periods of 9 hours, 12 hours or 24 hours, and so on; or on D1 we have periods of 7 days, 14 days, 20 days or 52 days.
For example: take the last 14 trading days (not counting Saturday and Sunday). A 14 day period holds 14 candles on D1, and with this timeframe you can work out the highest and lowest price of the period, and the average price of the period as well (the closes of the 14 D1 candles added up and divided by 14).
How to choose a timeframe to suit your trading style
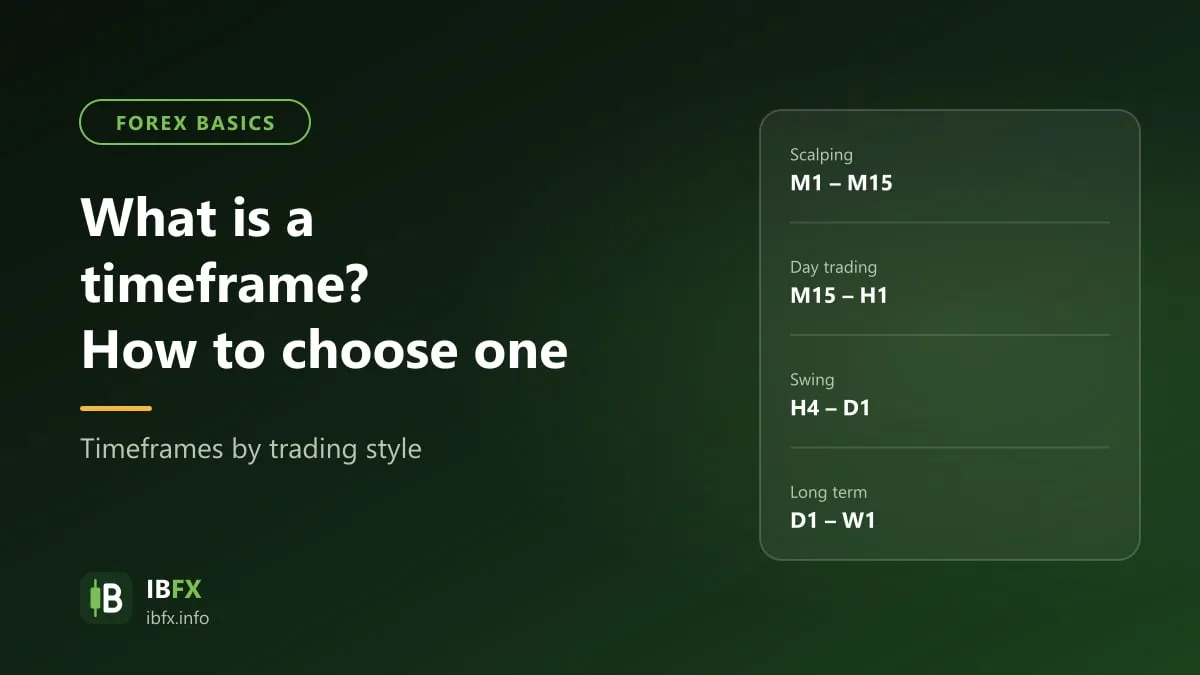
In the forex market there are 4 common trading styles, sorted by how long a position is held: scalping, day trading, swing trading and position trading, and each style has the timeframes that suit it. That is why the important thing is not which timeframe you pick but working out which style you are trading, or which style you are going to shape yourself into.
IBFX has an article on shaping your trading style and building a strategy to fit each style, which you can look at: Are you confusing trading style with trading strategy?
- Scalping: a style that holds a position for a very short time, only a few seconds to a few minutes. Traders who follow this style like things fast and accept a high level of risk. They have to sit watching the market without a break, may open several dozen trades or more in a day, and because the target on each trade is only a few pips, the spread and the fees take up a very large share. The timeframes that suit it are the short ones such as M1, M5 or M15.
- Day trading: a style that holds a position for a few hours and closes the trade before the day’s trading session ends, meaning no positions are held overnight. Day trading is a short-term style too, along with scalping, but it uses longer timeframes such as M15, M30 or H1. This is also the style a great many new traders follow.
- Swing trading (medium-term trading): the people who follow this style usually do not have much time to spend on trading and watching the market without a break, so they hold a position for a few days to a few weeks. The timeframes that suit this style are H1, H4 or D1.
- Position trading: the style that holds a position longest, from a few weeks to a few months, even a few years. The people who follow this style aim at the long-term trend, and they have to put up with large moves against them and with the overnight cost (swap) adding up. The timeframes that usually suit this style are D1, W1 or MN.
New traders are usually impatient to see a profit, so they often pick very short timeframes to trade, such as M1 or M5, and most of them fail badly. Scalping is a style that is very easy to take up but extremely hard to succeed at, because it calls for experience, knowledge and a professional response to sudden moves in the market. For a beginner we suggest starting from H1 upwards, because the smaller timeframes carry a lot of noise and call for quick reactions; that said, it still depends on how much time each person has and on their character.
One more thing to keep in mind when you choose a timeframe is the stop loss distance and the position size. On short timeframes the stop loss and take profit levels are usually close to the entry point (a few pips to a few dozen pips). On large timeframes such as D1 or W1 those distances can run to hundreds of pips. To keep the amount you can lose on each trade within your limit (1-2% of the account, for example), trading a large timeframe has to use a smaller position size to match; and if the account is too small, it may not be enough to trade a large timeframe at a sensible level of risk.
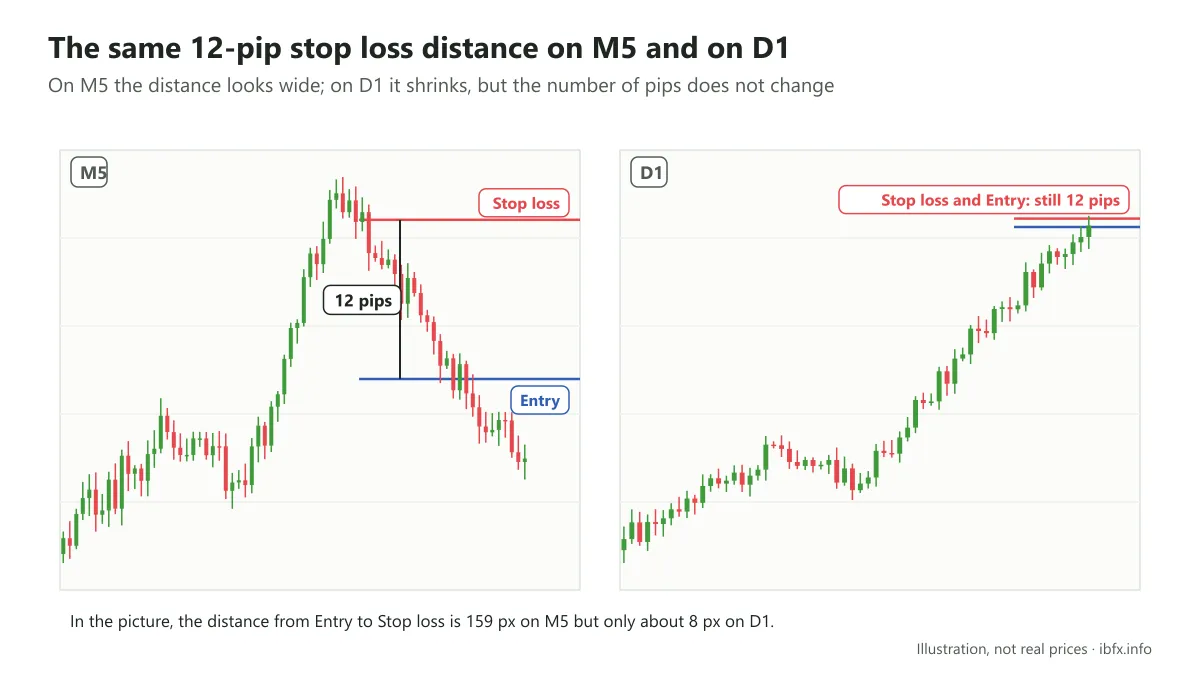
The picture on the left is the M5 timeframe, the one on the right is D1. The distance from the entry point to the stop loss on M5 is quite wide and clear, but checked against the D1 timeframe it shrinks, while the distance in pips does not change.
Multiple timeframe analysis and trading
Multiple timeframe trading means that traders usually use at least 2 timeframes to analyze and place their trades. Using several timeframes gives them the broadest view of the market, rather than watching price on a single timeframe only.
Most new traders work on a single timeframe only, treating it as the step of the whole market while leaving the other timeframes out. That easily puts them at risk, though, because a new trend or a reversal often shows up on another timeframe first. That is why, when you trade on one timeframe, you need to look further out by watching the market across several different timeframes.
The basic strategy for using several timeframes is that you pick a favorite timeframe, or the timeframe that suits your trading style, and then watch the market on a larger timeframe. The larger timeframe gives you the overall picture, and from there you work out whether the general trend of the market is up or down. Once you have the trend, you go back to the smaller timeframe you started with to work out the entry, take profit and stop loss points.
Using several timeframes also helps a trader read the trend more accurately. Suppose you are looking at a rising candle on D1: a rising candle on D1 only tells you that price moved upward that day, at what price it opened, at what price it closed and what High and Low it reached. But if you look at that candle on a smaller timeframe, such as M30, you will know in more detail how price moved through that day: did price rise first then fall, then end the session with another leg up, or did price open heading down and then turn up until the end of the session? The candle on the D1 timeframe cannot tell you any of that.
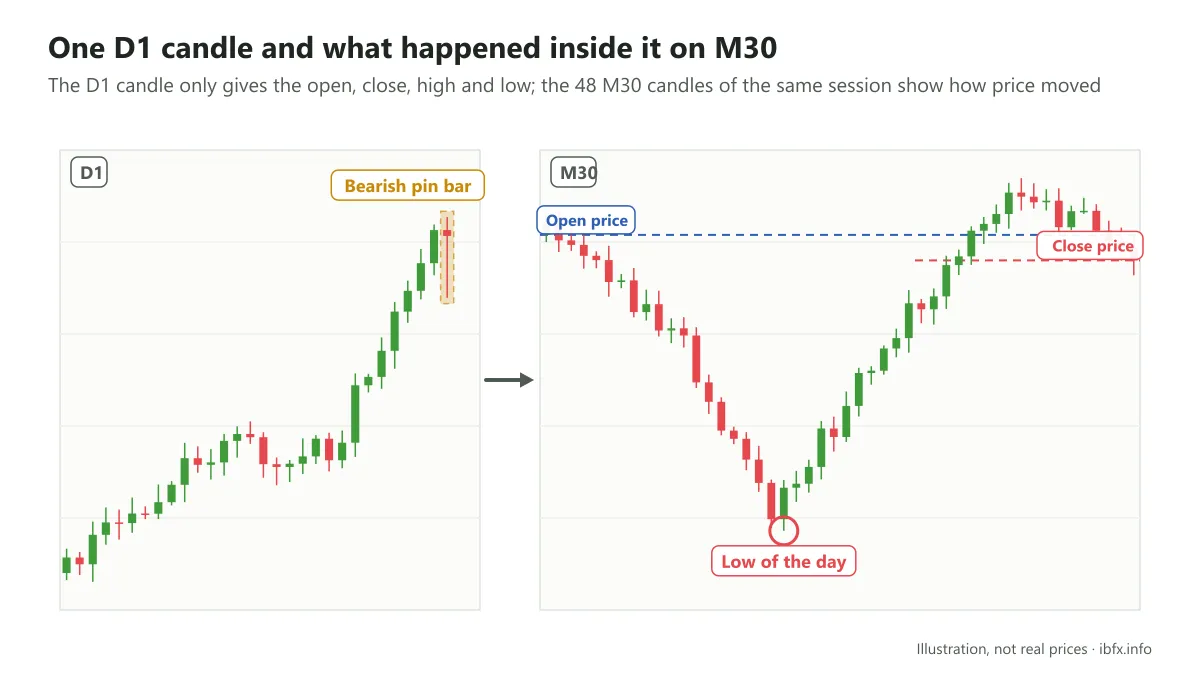
One trading session on the D1 timeframe is shown by a bearish pin bar. Looking at that candle, all we know is that the sell side tried to push price down deep but a stronger buying force pulled it back up, which makes the lower wick long. At the end of the session price is still below where it opened, but we will not know whether price was heading down or up towards the end of the session.
This D1 candle is dissected in more detail on the M30 timeframe. Looking at how price moved on this smaller timeframe, you can answer that question completely.
Using several timeframes to dissect candles this way matters a great deal when you trade candlestick patterns.
For example: analyzing a currency pair on the D1 and H1 timeframes
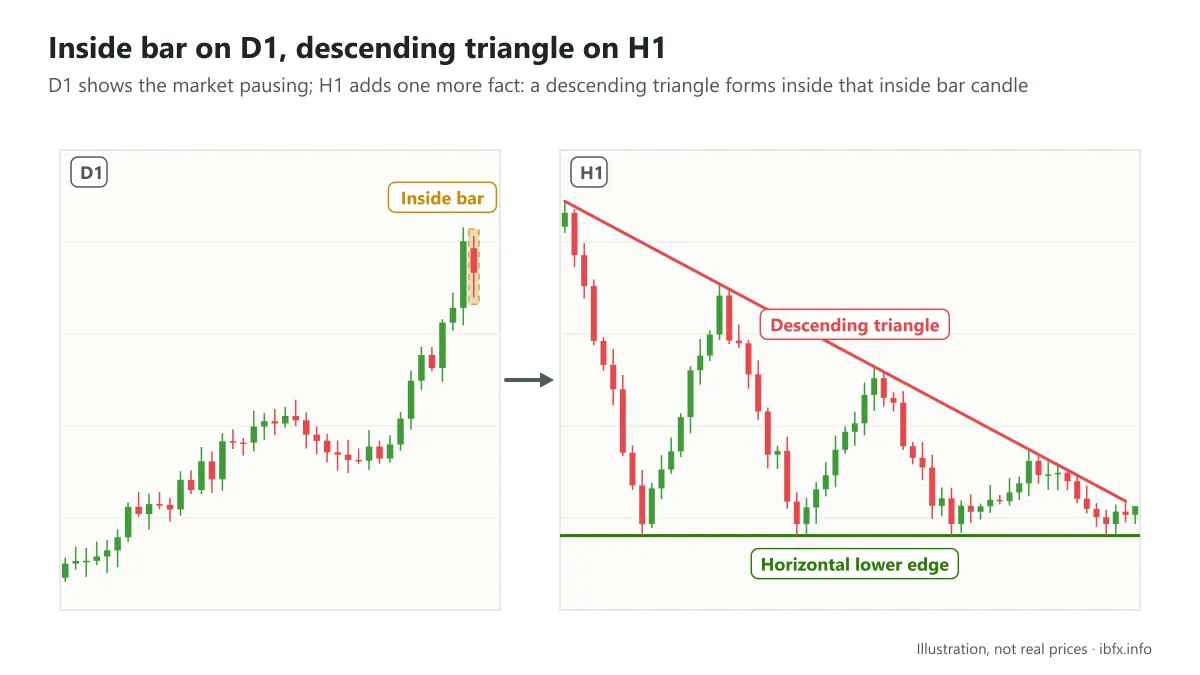
On the D1 timeframe, price is forming an inside bar pattern after a fairly long uptrend. The inside bar shows that the market is pausing and that price could break either way, so we need more evidence.
Looking at the price chart on the lower timeframe, H1, we can see that price is forming a descending triangle, a pattern for which the statistics show a downward break is more common than an upward one. Here you can consider a Sell when price breaks the lower edge of the triangle, with a stop loss.
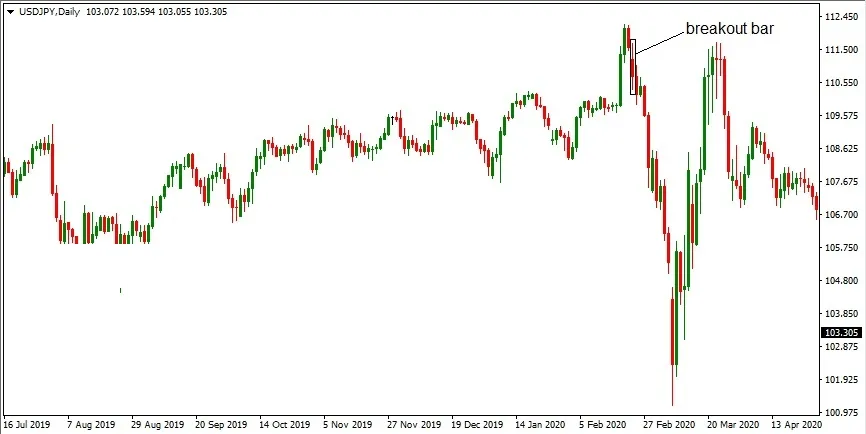
Back on the D1 timeframe, you can also wait for a candle to break the low of the inside bar before entering. In this example price did fall afterwards; but the signal is not right every time.
- Which timeframes do you trade on with multiple timeframe analysis?
It is called multiple timeframe trading, but from our experience we advise you to use only 2-3 timeframes; using more than 3 easily leaves you confused in your analysis. The largest timeframe is used to recognize the main trend, the second largest works out the medium-term trend, and the smallest is the short-term trend and usually the timeframe you enter on as well.
A few combinations of timeframes you can look at: (M5, M15, M30), (M5, M30, H4), (M30, H1, H4), (M30, H4, D1), (H1, H4, D1), (H4, D1, W1) and so on.
Using several timeframes to trade puts your analysis and your decisions on a sounder footing, and cuts down the subjective element of watching the market on a single timeframe only. To do it, though, a trader needs the skill and the experience to analyze, and you can manage it perfectly well with practice and patience.
Final thoughts
We hope that with what we have set out in this article you will understand the timeframe and what it means in forex thoroughly, and from there choose the timeframe that suits your trading style. Alongside that, practice multiple timeframe analysis on a demo account before you apply it with real money.