On this page
When you trade forex, one of the most important things you have to do is identify the trend. When you get it right, you trade against the trend less often, which improves your results and lowers your risk.
Identifying and drawing the trend line, or trendline, is basic knowledge that every trader has to understand properly. If you do not know it yet, read the article below to understand what a trendline is and how to draw one as accurately as you can.
What a trendline is
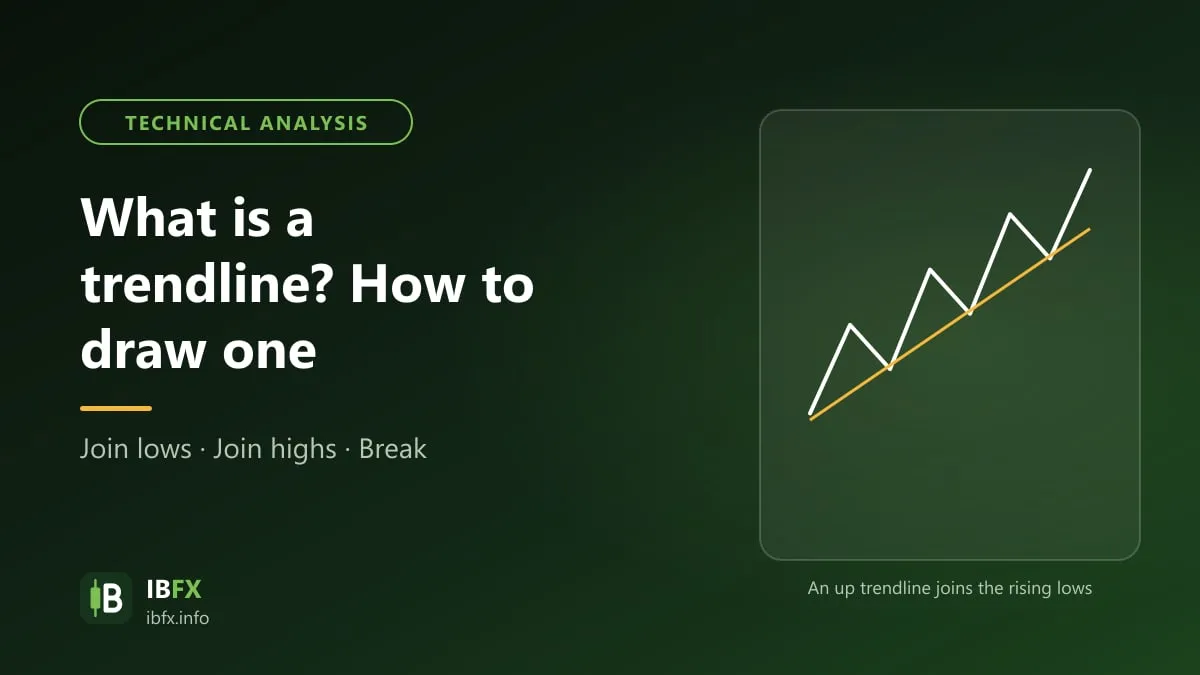
As the name says, a trendline is a straight line joining the highs to one another or the lows to one another. Hearing that, you will notice a trendline sounds a lot like support and resistance, right?
It does, and both mainly show a trader the areas of buying and selling pressure, the potential zones of supply and demand. The difference is that support and resistance are usually horizontal lines, while a trendline slopes.
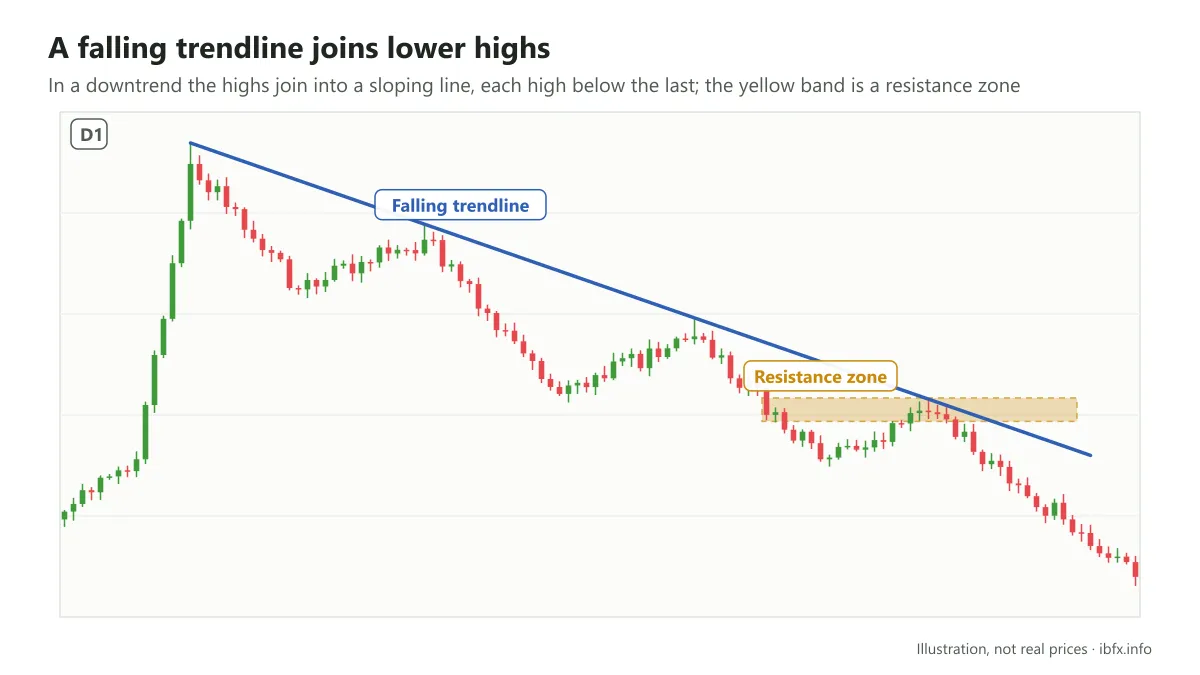
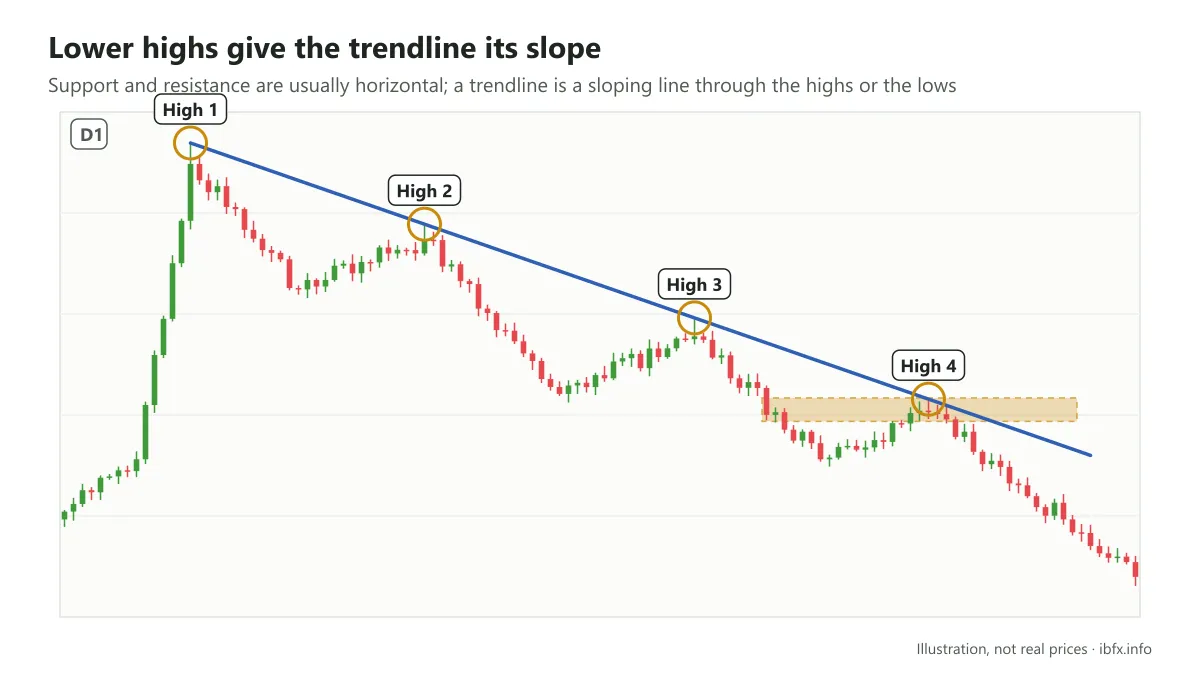
It has to slope because in a downtrend, when you join the highs to one another, each high is below the one before.
In the same way, in an uptrend, when you join the lows to one another, each low is above the one before.
So you can see that a trendline is really a kind of barrier, and that barrier is stronger, or worth more, the more times price hits it without breaking through.
How many kinds of trendline are there?
Some books and other material say there are 3 kinds of trendline:
- An uptrend (when it makes higher lows)
- A downtrend (when it makes lower highs)
- A sideways trend (when price only moves inside a given range)
In my own opinion, though, there are only 2 kinds of trendline: a rising trendline and a falling trendline.
From the definition above you can see that to make a trendline you have to join price points together. Each low has to be above the one before (a rising trendline), or each high has to be below the one before (a falling trendline), for the line to have a slope, and that is exactly what makes a trendline different from support and resistance.
But this is only my own opinion, and you may see it differently.
How do you draw a trendline correctly?
Drawing a trendline leans on technique, but every trader sees the chart differently, ask 9 people and you get 10 opinions, so they draw it in different ways.
To draw a trendline, though, you first have to identify the market trend, and then use the highs and the lows to join them together.
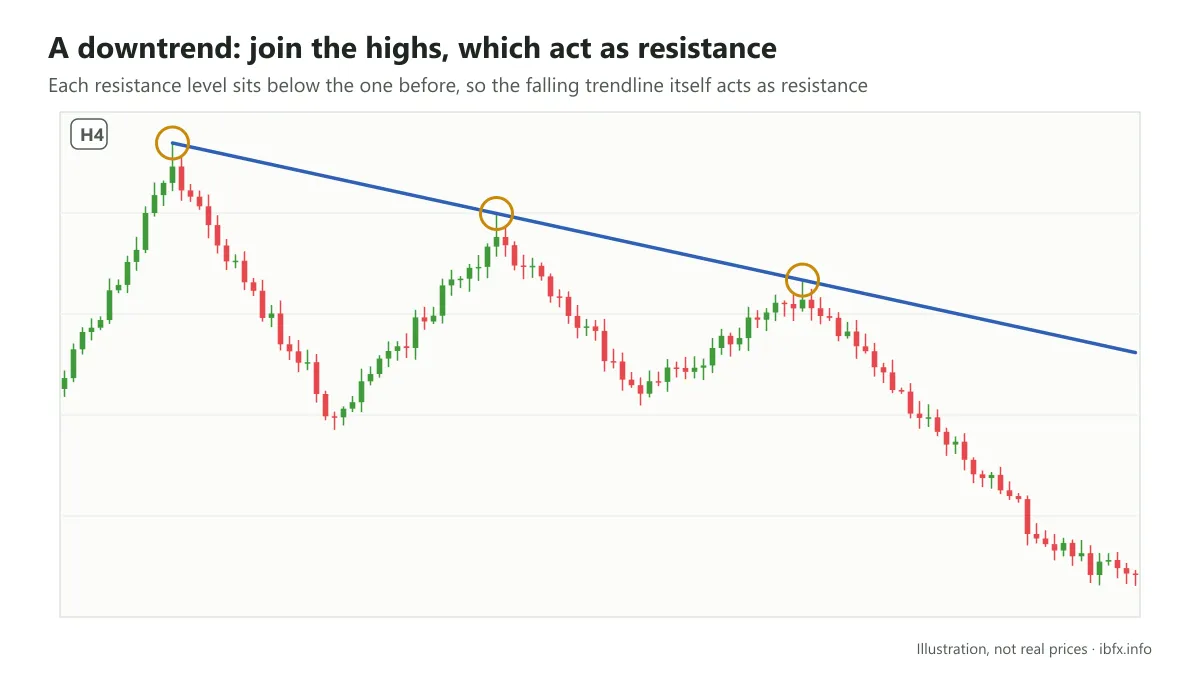
In a downtrend you join the highs to one another, which here means joining the resistance levels, so that each resistance level is below the one before.
In an uptrend you join the lows to one another, which here means joining the support levels, so that each support level is above the one before.
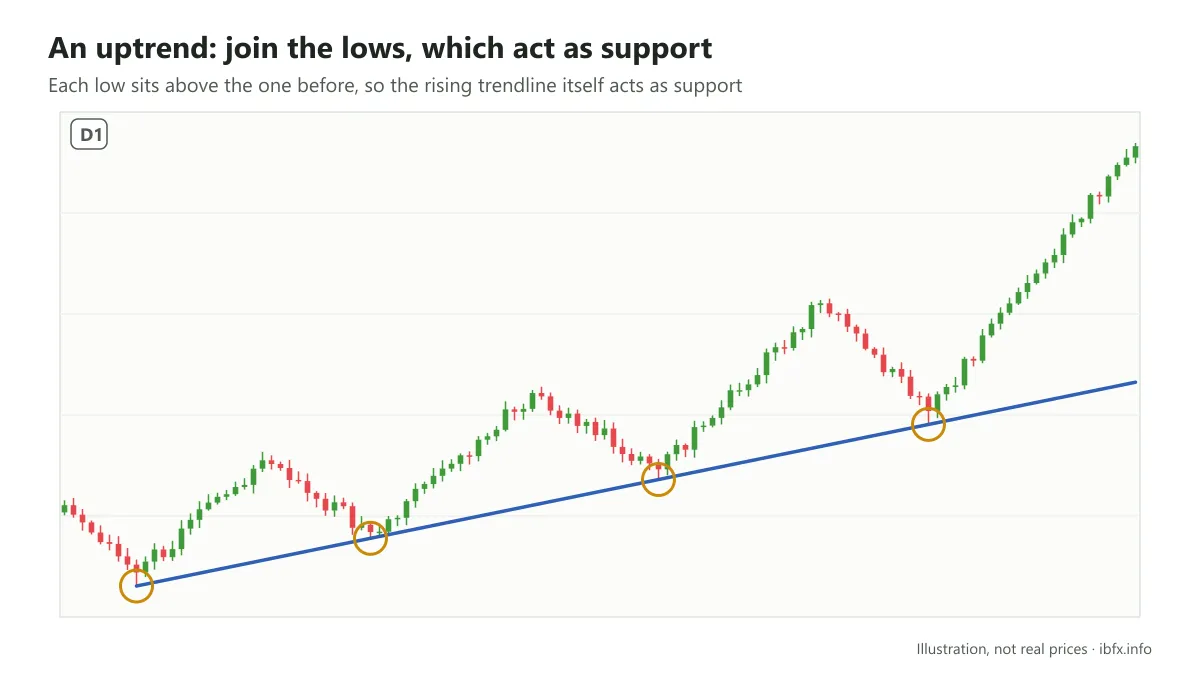
In that case the trendline is not only a barrier: it also acts like a support line (in an uptrend) or like a resistance line (in a downtrend).
Points to watch so that you draw a trendline correctly
- A trendline is never horizontal; it always has to be a sloping line.
There are only two kinds of trendline, a falling trendline and a rising trendline; when the market goes sideways (a horizontal line) that does not count as a trendline.
And in any situation there are 2 things that can happen:
- A falling trendline shows that the market is in a downtrend; if it is broken, the market can turn from falling to rising, or simply move sideways. If price cannot break the line, the downtrend carries on.
- A rising trendline shows that the market is in an uptrend; if it is broken, the market can turn from rising to falling, or move sideways. Breaking a trendline is a warning sign, not a certain reversal.
- You need at least 2 highs or 2 lows to be able to draw a trendline.
So the trend is confirmed when price touches the line and forms a third high.
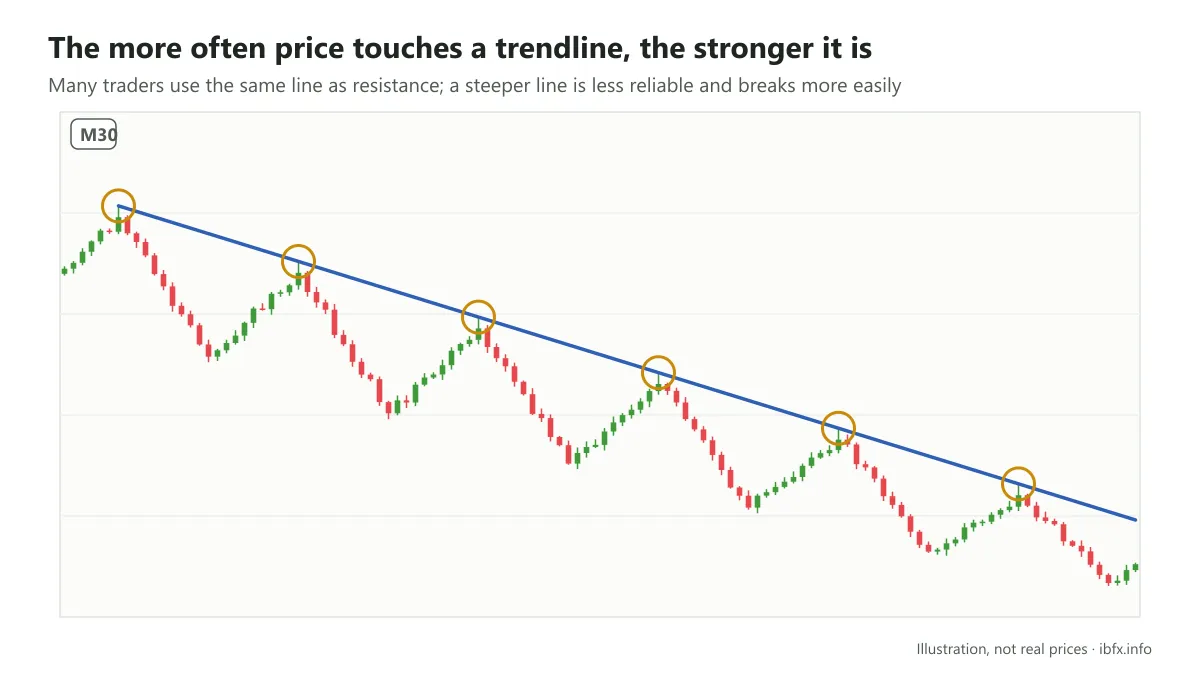
- The steeper the trendline, the less reliable it is and the more likely it is to be broken.
Basically, the more times price touches the trendline the more it is worth, because many traders use it as a support or resistance level.
- NEVER TRY to draw a trendline to fit what you think; let it follow the flow of the market.
- Should you use the wicks or the bodies when you draw a trendline?
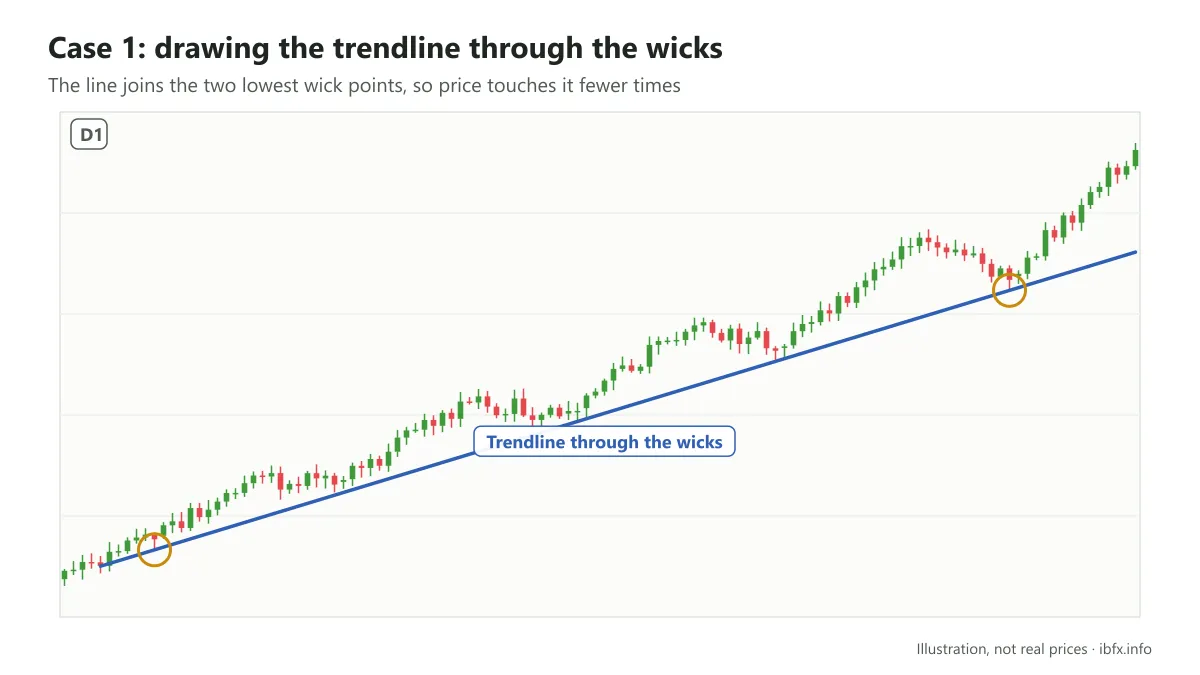
Some traders use only the candle bodies when they draw a trendline, while many others use the whole wick. There is no compulsory rule; when a wick is unusually long you can ignore it. What matters is drawing one way consistently on the same chart. Look at the two charts below:
Case 1: drawing through the wicks as well
Case 2: ignoring the wicks and leaving them out
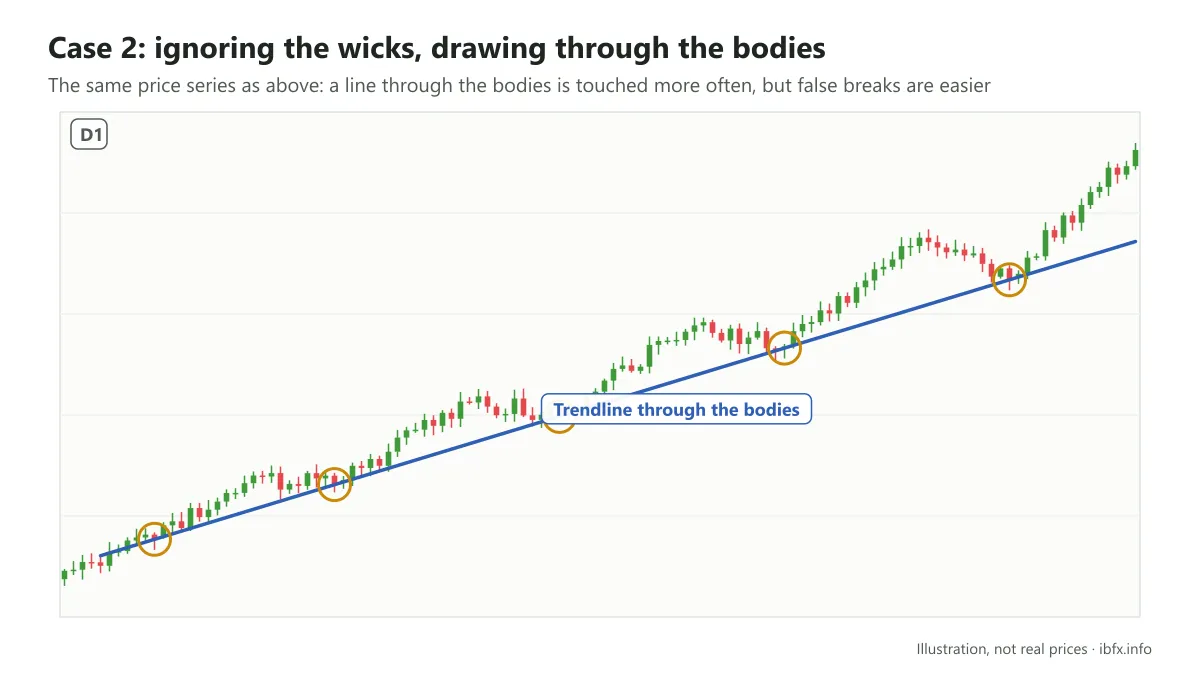
Clearly, if you draw through the bodies only, price in the example above touched the line many times; in many cases, though, drawing through the bodies only gives you a false break. You can then easily take the wrong trade. Look at the example below to understand it better:
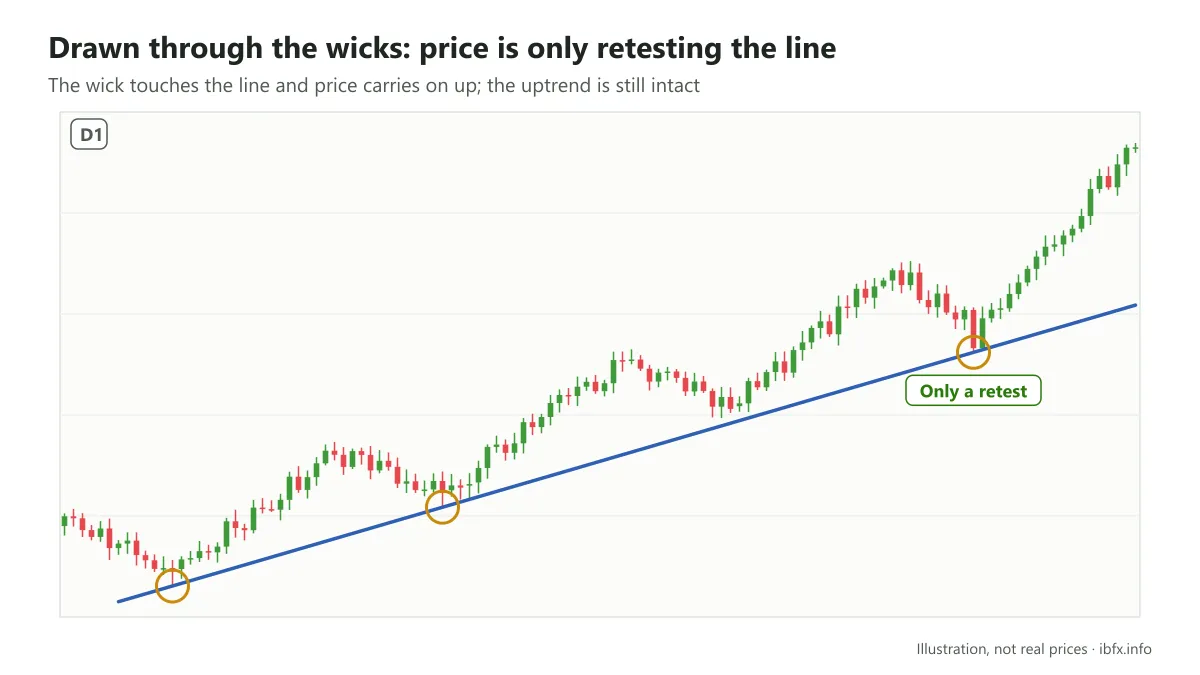
Drawing through the wicks as well, you can see that price is only re-testing this trendline, and you may be patient enough to go on with a Buy.
When you do not draw through the wicks, though, it looks like the picture below:
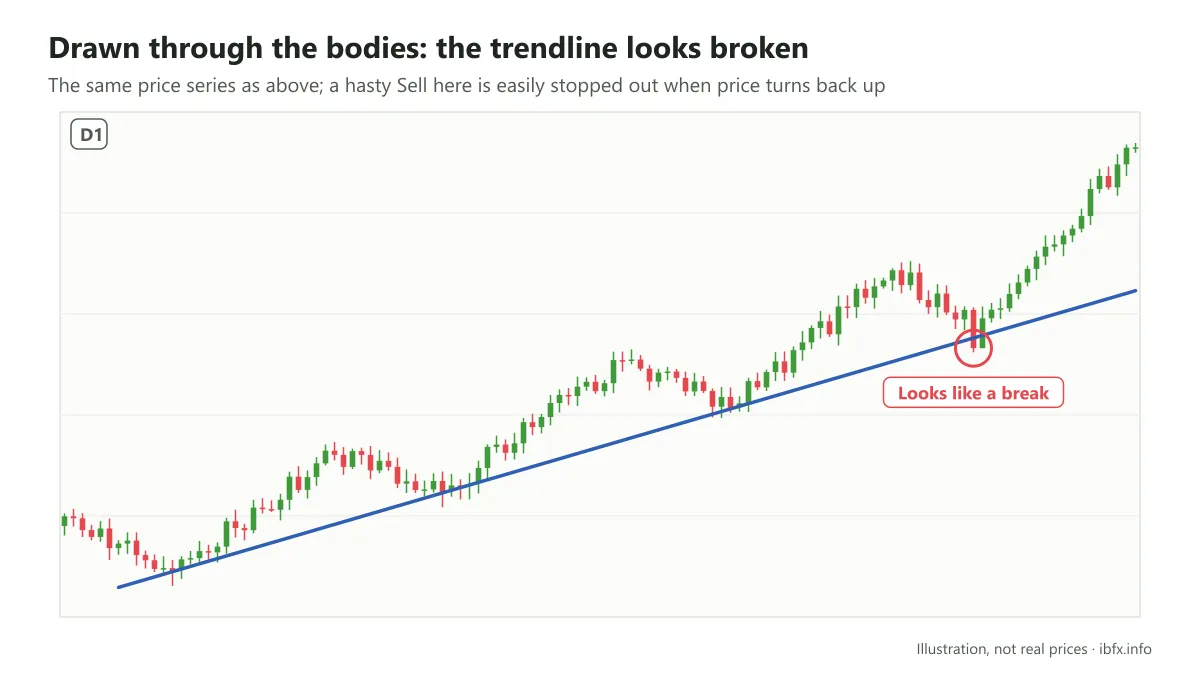
Here you may wrongly believe the trendline has been broken and that the market is turning from an uptrend into a downtrend, and take a Sell right here. And you may well be stopped out.
- To confirm a trend you need at least three points on the same line!
When you draw a trendline you must have at least two points. To confirm the trend as support or resistance you need a third point as well, lying on the same line as the two before it. Look at the example below:
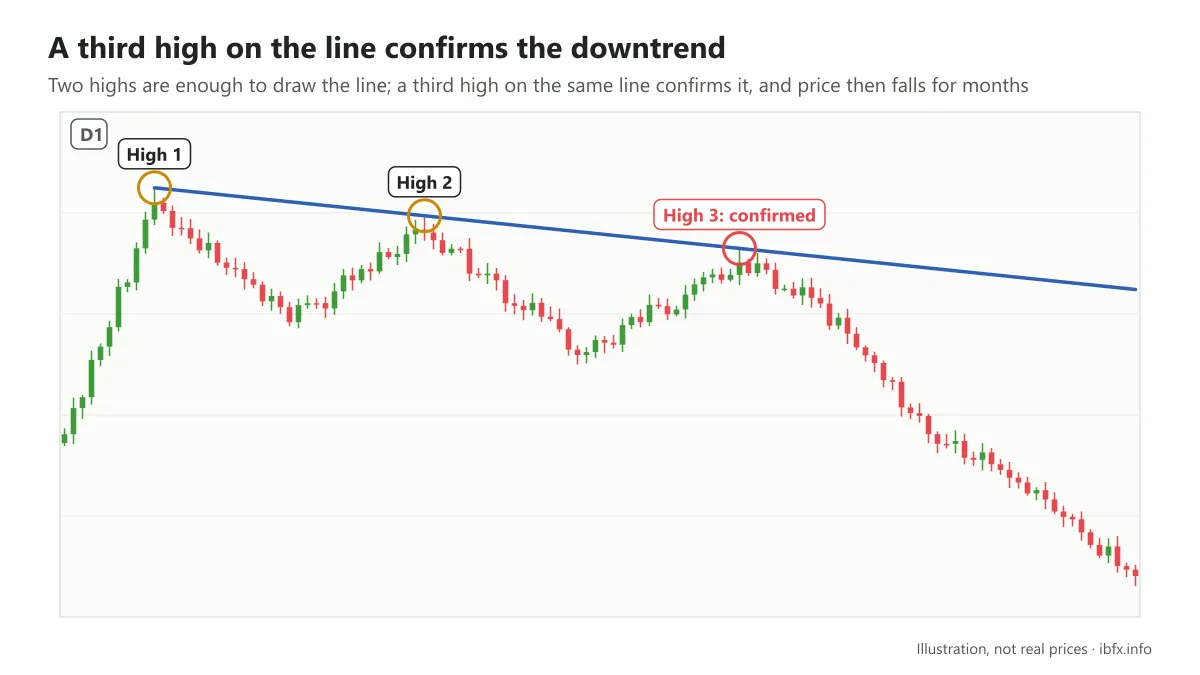
As you can see, the downtrend formed with the first and second highs, which I circled. The third high is the signal that confirms the trend. The chart here is the Daily time frame, so many D1 candles touched the line to test it but could not break it, and price went on falling for months.
- Never think of a trendline as just a thin line; more exactly, it is a zone or a level.
To confirm a trend the line has to touch at least 3 price points, and those 3 points sit at different times and at different prices, which for a trendline means higher lows (in an uptrend) or lower highs (in a downtrend), so even though it is a straight line it covers a whole zone, a specific range.
Another important point is that the stronger a trendline is, the more often price will try to “bounce” up or down into this area to test it again, so when price cannot break through you very often get a candle with a long wick right there.
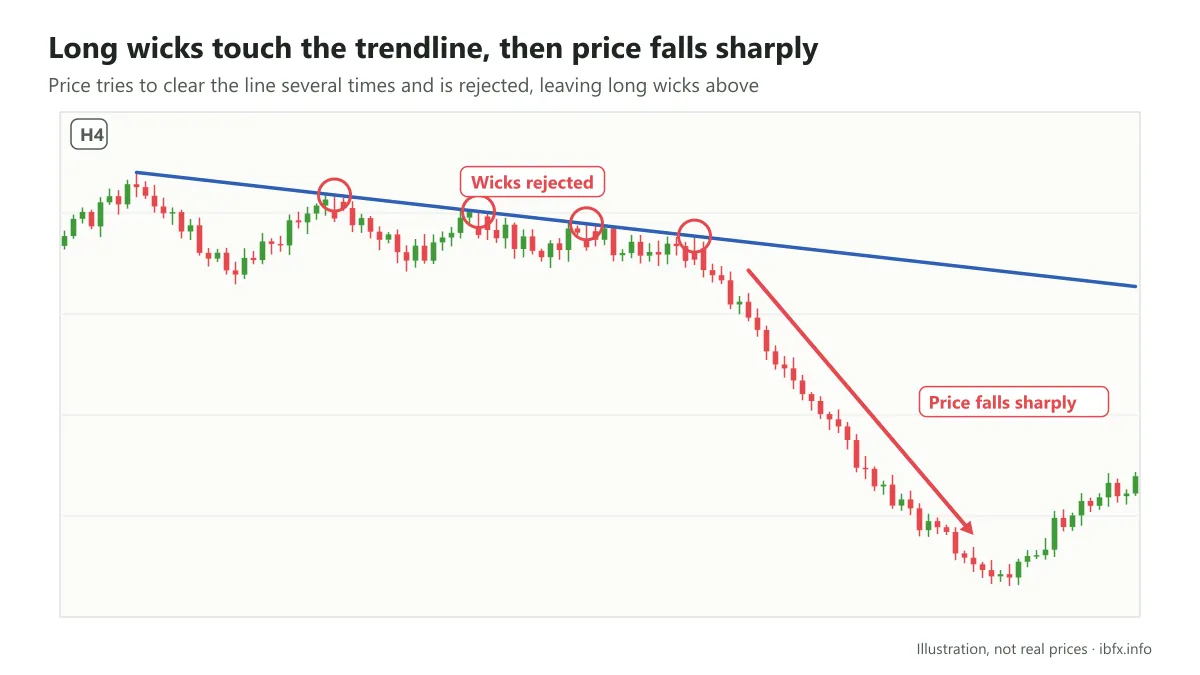
Another example. You can see a falling trendline forming on the chart. The third high confirmed this trendline. And if you look carefully, you see price action showing up many times, with most candles trying to “bounce” up to touch the trendline drawn above. That left many wicks showing price being rejected while it tried to break through. As a result, price could not break the line, so it fell a long way before it broke the trend and rose again.
How to trade with a trendline
We have gone through how to identify the trend and how to draw a trendline. Now we move on to the next part: how to trade with a trendline.
There are three ways to trade with a trendline:
- Trading with the move of the trend,
- Trading the corrective move
- Trading the break
Trading with the move of the trend
When you draw a trendline you can work out and prepare a trade with the move of the trend. Once the trendline is confirmed by 3 points, you will find a clear entry for a trade. This way, if the uptrend is confirmed, you can trade on the next “bounce” of price from that trendline, assuming price action has confirmed your idea. Look at the picture below:
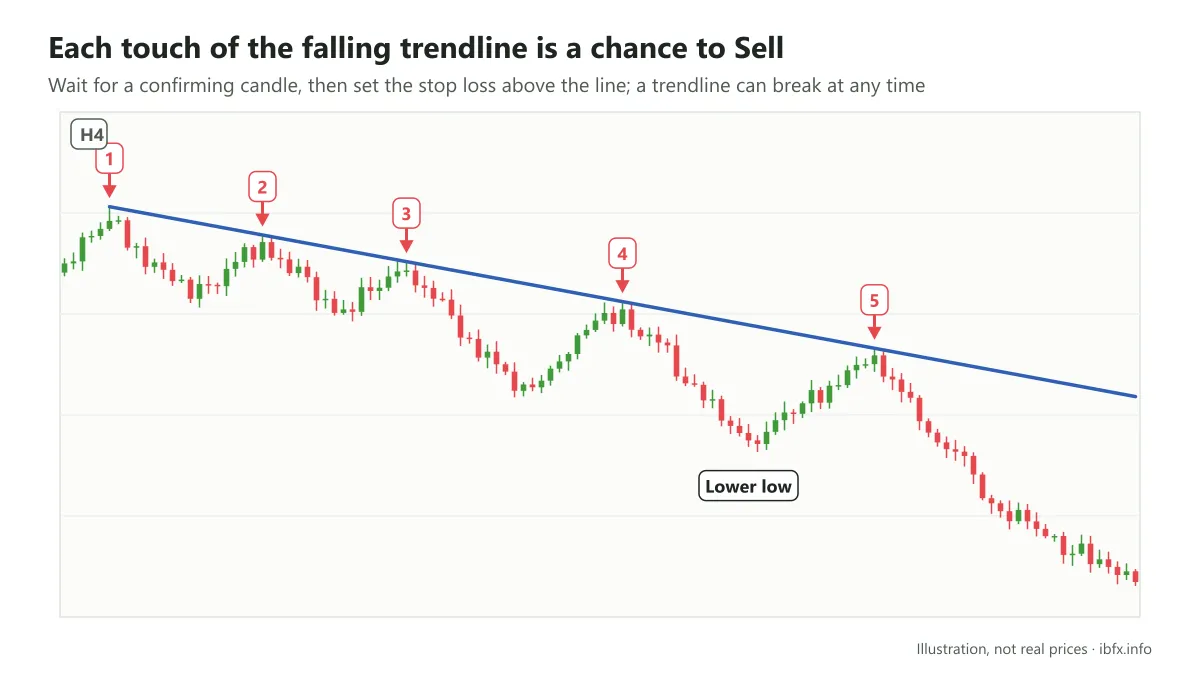
This is an H4 chart, and price has touched this trendline more than 3 times, one of the key points for confirming a trendline.
After price hit the trendline for the third time, a downtrend formed because price could not break the trendline. So it started to make a new lower low and a new corrective move.
Price then went on to “bounce” up and touch the blue trendline a fifth time, but it was not strong enough and turned back down again. At that point price made a lower low. That is why price fell quite sharply.
This way of trading with the trend is usually recommended for beginners more than trading the break, but you still have to wait for a candle to confirm that price is bouncing off the trendline, and put the stop loss on the other side of the line, because a trendline can be broken at any time.
Trading the corrective move
A corrective move is a stretch where price runs temporarily against the main trend. It usually shows up after price has risen or fallen a long way, before price goes back to following the original trend. A correction is usually smaller than the leg that follows the main trend, and price behavior during a correction is usually messier and harder to read. As a result, trading the corrective move (against the main trend) is riskier. Look at the example below:
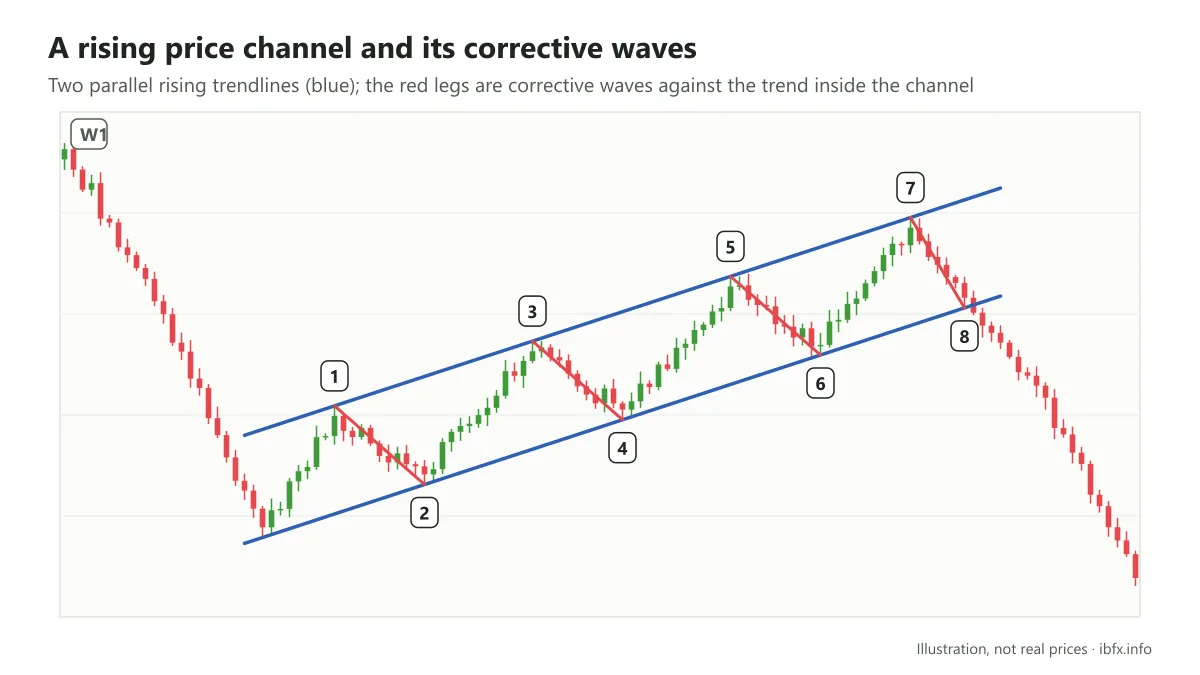
This is a Weekly chart. Note the two parallel rising trendlines (in blue). The numbers marked on it show you the matching moves. The lines show that price is moving inside a channel, and the red lines are the corrective moves of the price channel.
With a price channel, in an uptrend like the one above, you only need two lows to draw the lower line, not three as with a single trendline, because the parallel line above running through the highs helps confirm the structure of the channel.
A parallel price channel is a fairly common way to trade. Many traders wait until there are about 4 to 5 touches on both edges before they treat a price channel as reliable.
Note that corrective legs usually have a smaller range because they run against the general trend. In a rising price channel like the example above, trading with the trend means looking for a Buy when price comes back to the lower edge; placing a Sell when price touches the upper edge is trading against the trend (with the corrective leg), where the potential profit is usually smaller and the risk higher.
Trading the break and the reversal
The last way, and also the most common one: trading when the trend is broken. If price is moving in a fixed direction and you get higher highs and higher lows, an uptrend is forming. But this pattern can perfectly well reverse. When that happens, price changes and starts moving in the opposite direction.
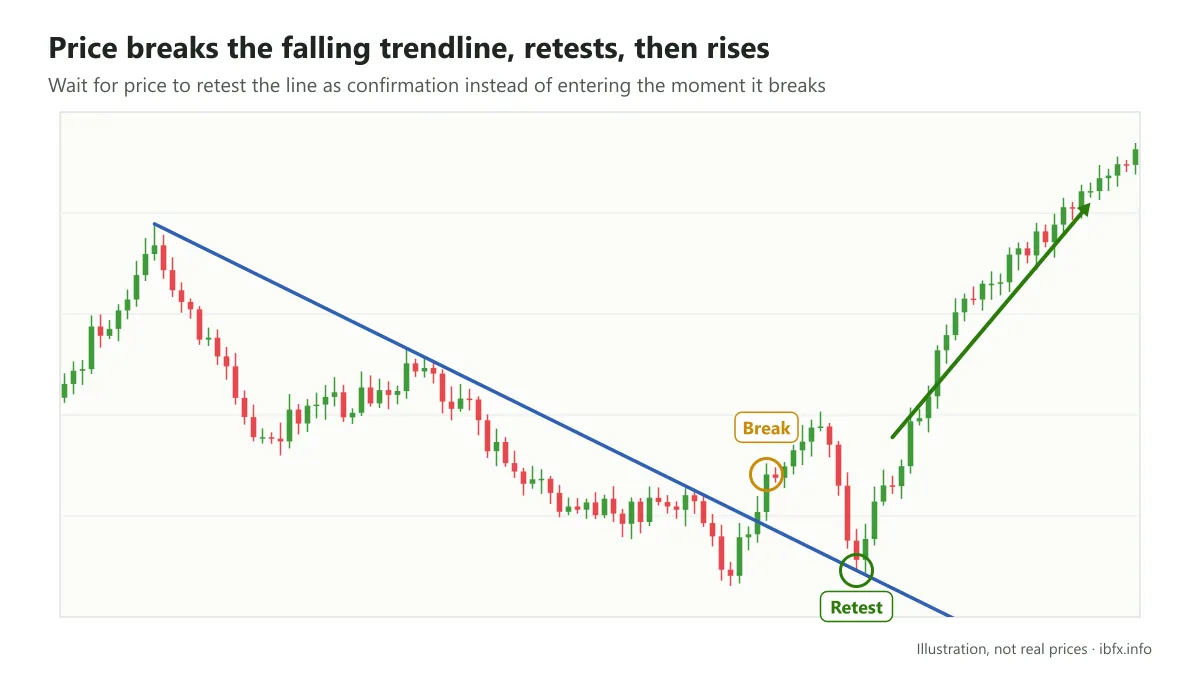
In the example above, after the break price tended to retest, and when it could not push back through the trendline price rose quite sharply. So the better way to trade is to wait for price to retest as confirmation instead of opening a position the moment the line is broken.
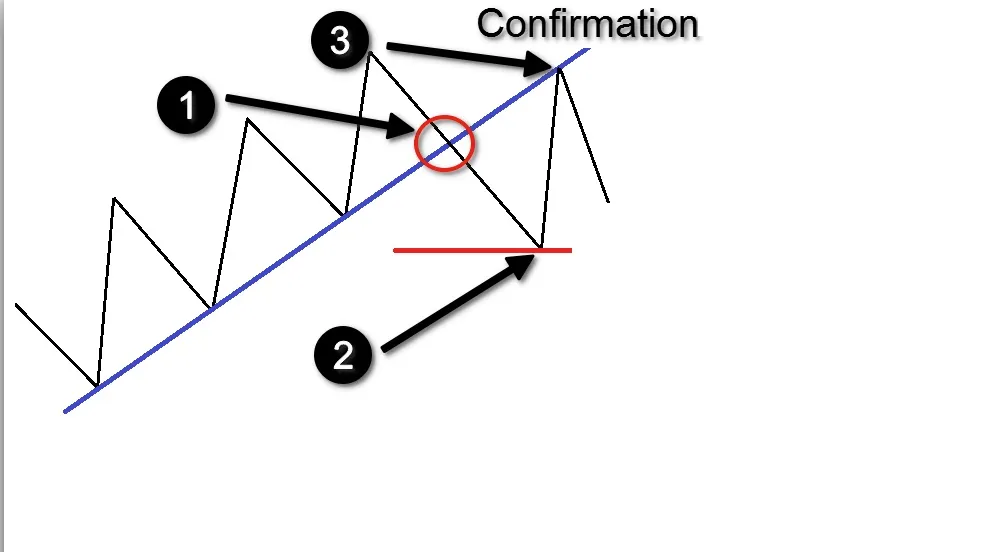
Note this: be careful about trading the break. If you are not careful, price breaks the trendline but is not strong enough to confirm a reversal pattern. Or you simply drew the trendline wrongly, so you wrongly believe price has broken it and that a reversal is coming, and you rush into a trade. On top of that, because a trendline should be treated as a zone and not as a thin line, one candle going through it is not enough to conclude that the trendline is broken; wait for more confirmation (a candle closing clearly outside, a failed retest). Read more: what a breakout is.
So with the explanations and examples above, you now know how to trade with a trendline. Practice drawing trendlines on a demo account before you use them with real money.