On this page
Analysis in trading is usually split into two schools, fundamental analysis and technical analysis. Technical analysis always rates the trend as important, and working out whether the current trend is strong or weak helps a trader choose the tools and the strategy that suit each stage of the market.
What is the ADX indicator?
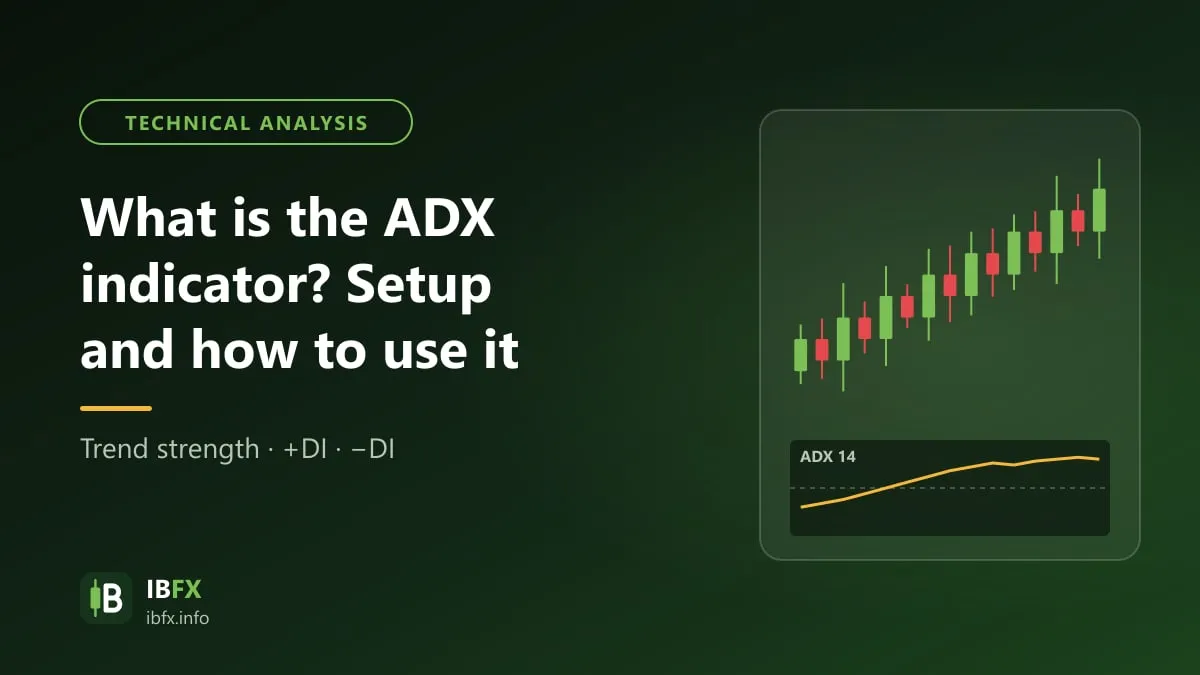
The ADX – the Average Directional Index – is a technical indicator belonging to the Directional Movement system developed by J. Welles Wilder (introduced in 1978). ADX measures the strength of a trend, so a trader can tell when the market has a clear trend and trend-following tools are worth using, and when the market has no trend at all.
ADX is worked out from the two lines +DI and -DI, smoothed over a set number of sessions, 14 by default.
ADX is the technical indicator used to measure the strength of a trend.
One important note: ADX only tells you whether the trend is strong or weak, not whether it is an uptrend or a downtrend. A rising ADX may mean an uptrend is getting stronger, or that a downtrend is getting stronger; the direction of the trend is given by the two lines +DI and -DI.
With the ADX indicator you can follow the momentum of the trend: if each ADX peak is higher than the one before, the momentum of the trend is building, and a trend trader can carry on looking for chances to enter with the trend.
The other way round, if each ADX peak is lower than the one before, the momentum of the trend is fading. The trend may still carry on, but a trader needs to be careful and more selective about new signals.
The parts of the ADX indicator
The ADX indicator is made up of the following parts:
The first is the ADX line (14 sessions by default), with values from 0 to 100, used to measure the strength of the current trend. The second is the DMI – the Directional Movement Index – made up of the two lines +DI and -DI: +DI above -DI shows the buyers have the upper hand, and -DI above +DI shows the sellers have the upper hand.
Most trading software has this indicator built in; the colors and the shape it is drawn in may differ, but you read it the same way.
As a rule, an ADX above 25 means the market has a trend strong enough to trade; an ADX above 50 means a very strong trend. At that point you combine it with the DMI: you can favor a buy when +DI crosses above -DI (or while +DI sits above -DI), and favor a sell when +DI crosses below -DI (or while +DI sits below -DI). The other way round, if ADX is below 25 the trend is not yet clear, and a trend trader is better off standing aside and watching.
Why ADX?
As said above, ADX is the indicator that measures how strong or how weak a trend is. Trend traders usually use ADX to filter out the stretches in which the market has a strong trend, and only then open a position.
A strong trend is usually taken to be present when ADX is above the 25 level, and that is when a trend-following strategy fits. The other way round, when ADX sits below 25 it is better to avoid trend-following strategies and pick one that suits a sideways market.
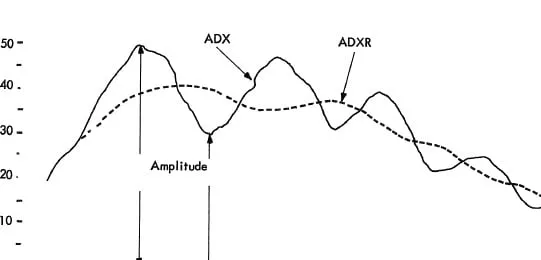
The parts of the ADX indicator and the range it swings in.
When ADX is low, price usually moves sideways. You can use ADX to watch for the moment price leaves that sideways zone: when ADX climbs above the 25 level after price has broken out, that shows the breakout has force behind it, although you still have to watch out for a false break.
The values of ADX are usually read as follows:
Trend strength: 0-25 is an unclear or weak trend; 25-50 is a strong trend; 50-75 is a very strong trend; 75-100 is an extremely strong trend (very rarely seen).
In general, when the ADX line rises the strength of the trend is building and the market is moving in one clear direction; when the ADX line falls the trend is weakening. Note that a falling ADX does not mean the trend is going to reverse, so if you trade reversals on the back of ADX you need to be extremely careful.
Setting up the ADX indicator
You can add the ADX indicator to an MT4 chart by going to “Insert” – “Indicators” – “Trend” and choosing “Average Directional Movement Index”.
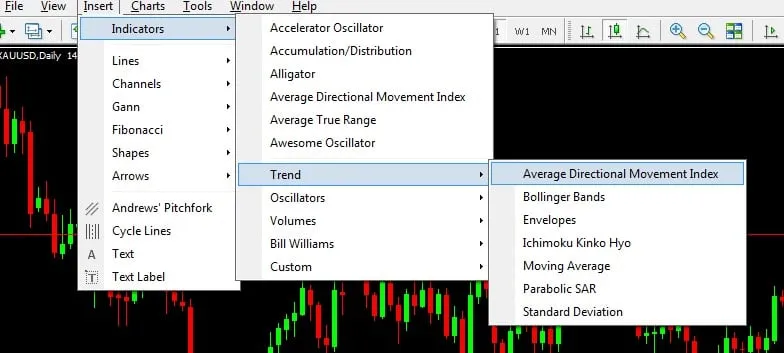
The screen you set the ADX indicator up from in the MT4 software
Trading with ADX
The basic way of trading with ADX is as follows:
A strong trend usually comes with ADX rising steadily. Traders usually combine ADX with the 2 lines +DI and -DI to judge buy and sell signals: when +DI and -DI cross while ADX is high (above 25) and rising, that signal is more reliable than the same cross while ADX is low.
ADX also helps you choose the right family of tools. If ADX sits below 25, the market has a weak trend or is moving sideways, and oscillators such as RSI and Stochastic (buy near support, sell near resistance) usually fit better. If ADX climbs above 25 the trend is fairly strong, and trend-following tools such as the moving average usually give better results.
When you trade with ADX, the +DMI (+DI) and -DMI (-DI) lines tell you the direction of the move: the buyers have the upper hand when +DI is greater than -DI, and the sellers have the advantage when -DI is greater. The crossing of +DI and -DI, taken together with the ADX line, makes up a simple trading system:
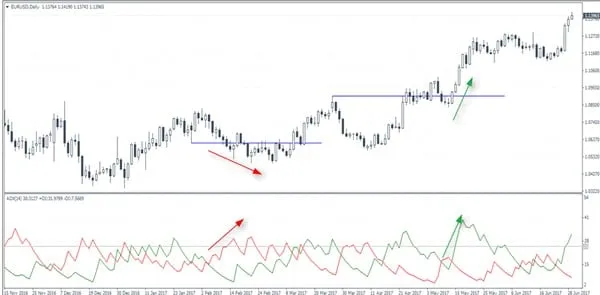
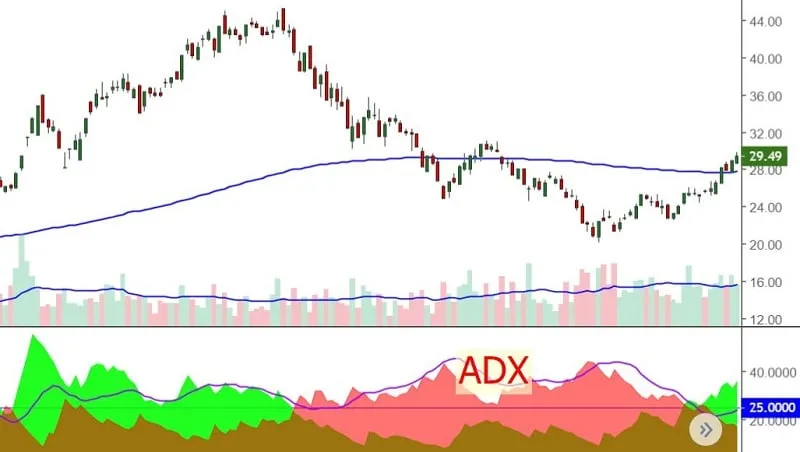
A trading chart using the ADX indicator.
+ Take a Buy when the +DI line crosses above the -DI line and the ADX line is above the 25 level. The stop loss usually goes below the low of the candle on which the signal appeared.
+ Take a Sell when the -DI line crosses above +DI and the ADX line is above the 25 level. The stop loss usually goes above the high of the candle on which the signal appeared.
The crossing signal of the DMI is usually more reliable when the market has a clear trend, and it gives plenty of false signals when the market moves sideways with no trend.
Every technical indicator has a strength of its own, and trend-following tools usually work better when the market really is trending; ADX helps you recognize those stretches.
Working out the current trend so as to choose a suitable tool is a question many investors ask, and ADX is a useful tool for traders who follow the trend. Combine ADX with price action analysis and other indicators, always place a stop loss, and do not forget to check the economic calendar so that you avoid the moments when news makes price swing hard.
See also: forex brokers, what to check before you open an account