On this page
Among the chart types, the candlestick chart is the one traders pick most often for technical analysis today. A candlestick chart and a bar chart both show 4 price levels: open, close, high and low, but the candlestick chart uses a colored body, which makes it far easier to read. When candles are put together into groups, a trader can read the balance between buyers and sellers, and get a hint of the price scenarios that may play out.
Below we introduce 5 reversal candlestick patterns; put together with a trendline, RSI, MACD, Fibonacci or Elliott wave analysis tools, they become a useful instrument when you analyze the forex trading market.
The Three Line Strike pattern
The Three Line Strike pattern is built from 3 long-bodied bearish candles one after another inside a downtrend. They are followed by a bullish candle that pushes price back to the point where the pattern began. If the trend before it was a falling one, this pattern is treated as a possible signal of an upward reversal.
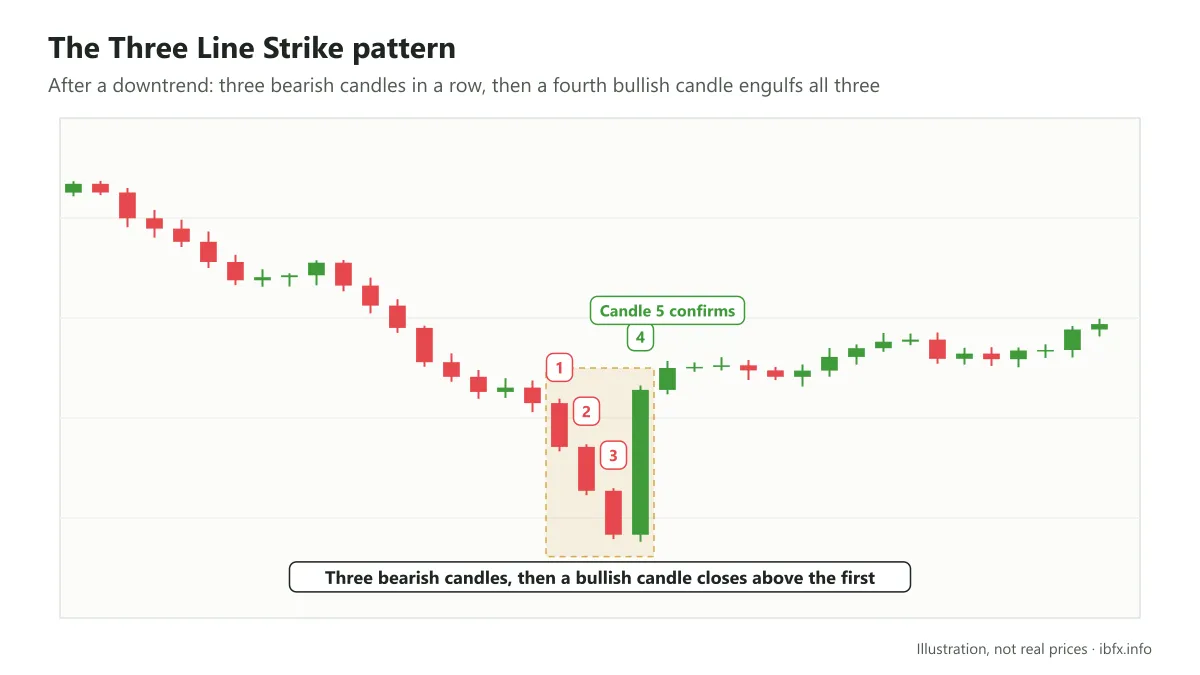
After you see 3 bearish candles each closing lower than the day before, and then on the fourth day a strong bullish candle engulfing all 3 candles before it (closing above the high of the first bearish candle), the pattern is complete. To be more certain, you can wait for confirmation from a fifth candle that is bullish before you consider a BUY order, with the stop loss below the low of the pattern. According to Thomas Bulkowski’s figures, this pattern points the right way in about 84% of cases.
The Three Black Crows pattern
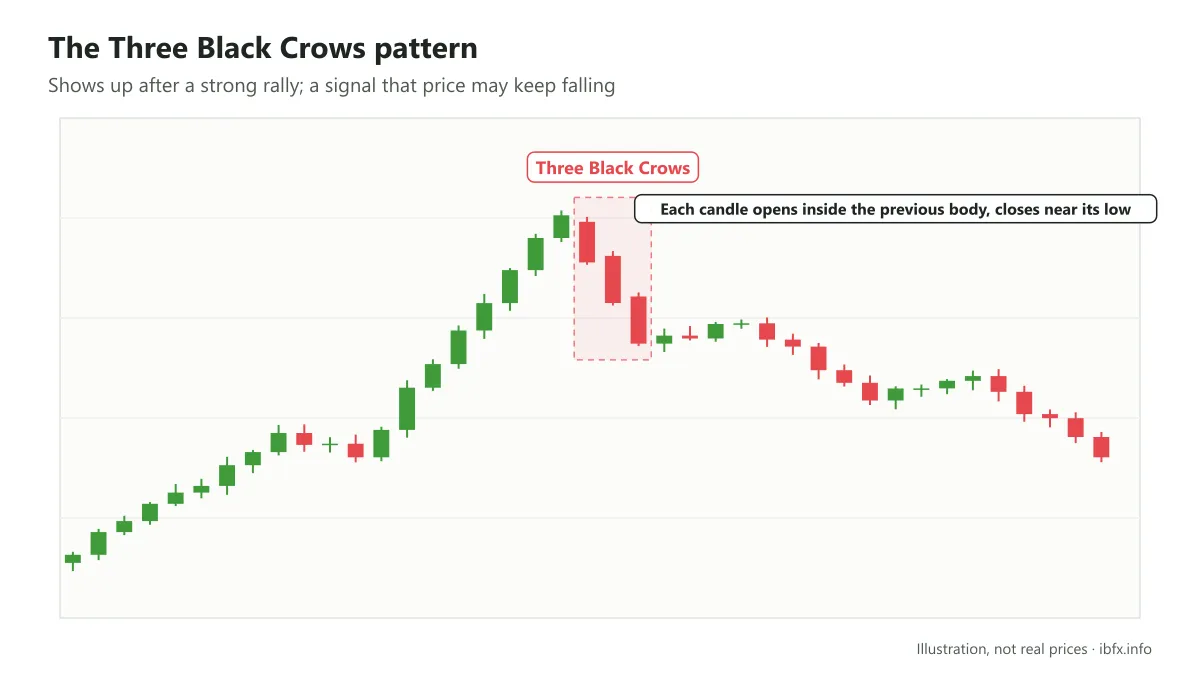
The Three Black Crows candlestick pattern shows up after a strong rally. Every candle in the pattern is a bearish candle whose close sits near the low of that same candle. The open of each candle in the pattern sits inside the body of the candle before it. This pattern is a signal that price may keep falling to lower levels. According to Bulkowski’s figures, this pattern points the right way in about 78% of cases.
The Evening Star pattern
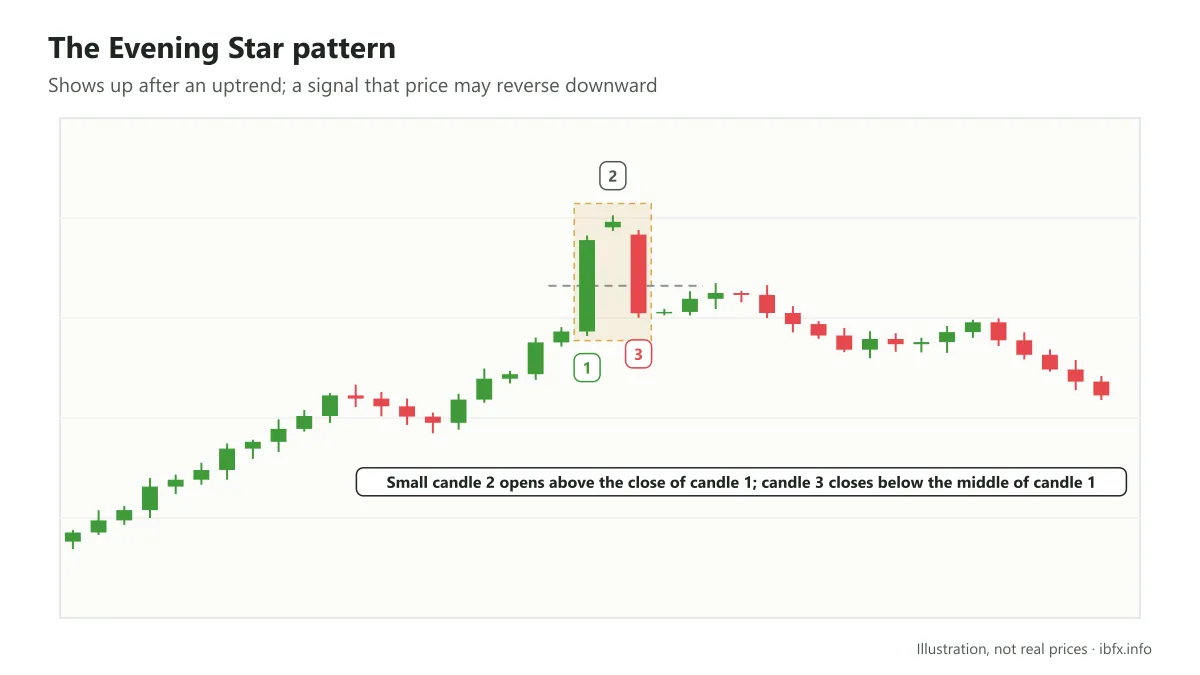
This reversal pattern takes shape after a strong uptrend, the first candle being a long bullish candle that follows a continuous rise. Next comes the second candle, which creates an upward price gap, meaning it opens at a price higher than the close of the candle before it. The second candle ought to be a small one and can be bullish or bearish, but the most important thing is that the body of the second candle has to sit above the body of the first. The third candle that forms the evening star is a strongly bearish candle whose close lies deep inside the body of the first bullish candle, a signal that price may keep falling. According to Bulkowski’s figures, this pattern points the right way in about 72% of cases. Note: in forex the next candle usually opens right at the close of the previous one, so a price gap rarely appears; many traders still accept the pattern when the second candle has a small body sitting up in the high area. See also: The Evening Star candlestick pattern.
The Morning Star pattern
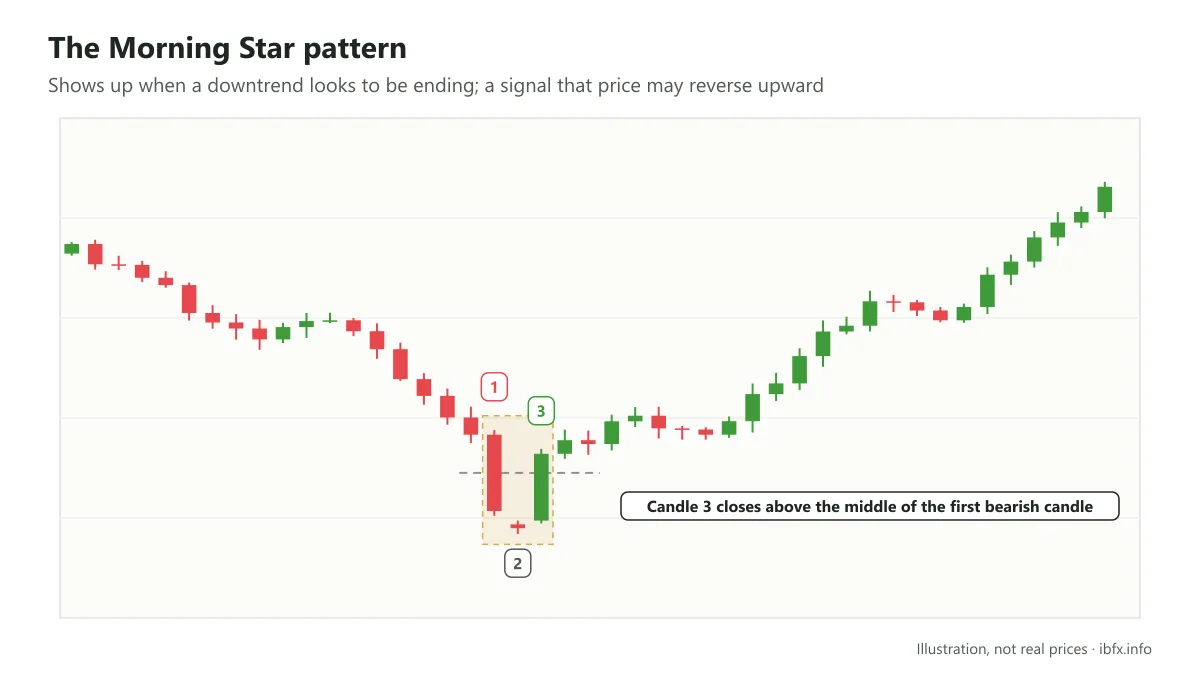
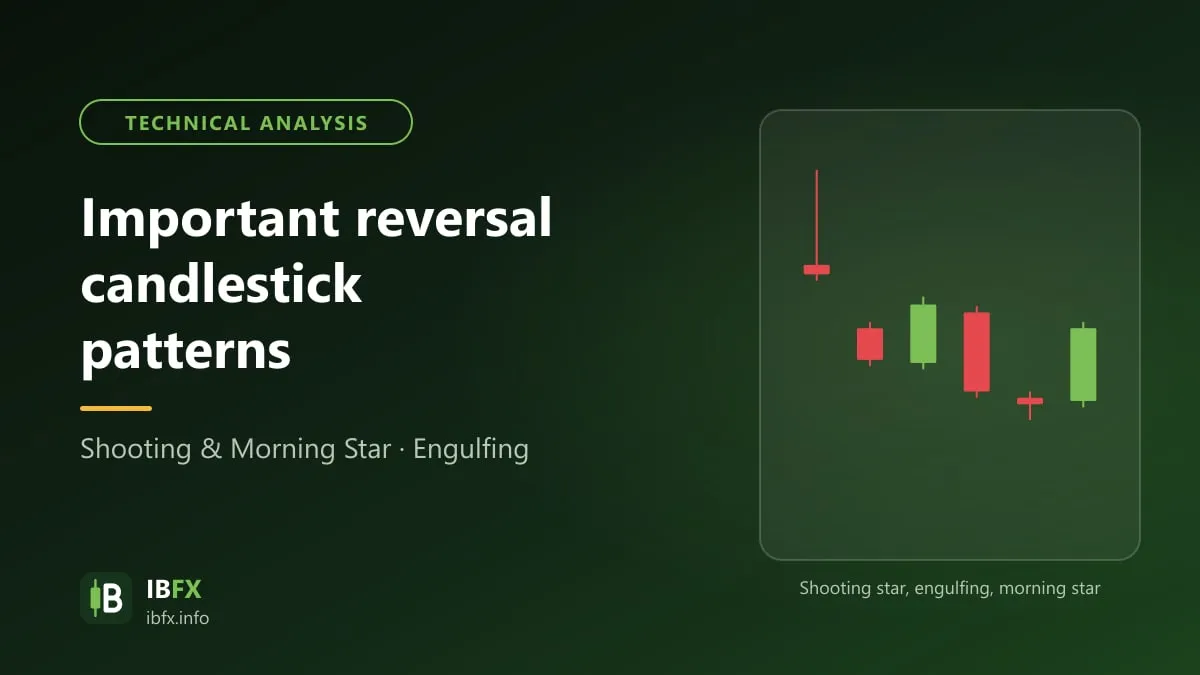
The opposite of the evening star is the morning star pattern, which usually forms when a downtrend shows signs of ending, marked by a large red bearish candle. On this first day the fall is perfectly clear (it keeps making new lows). By the second candle the selling pressure has stalled; the second candle has a small body (it can be a doji) and can be bullish or bearish.
On the third day a strong bullish candle appears, usually closing above the midpoint of the body of the first bearish candle. At that point the pattern is complete, a signal that price may reverse upward.
The Abandoned Baby pattern
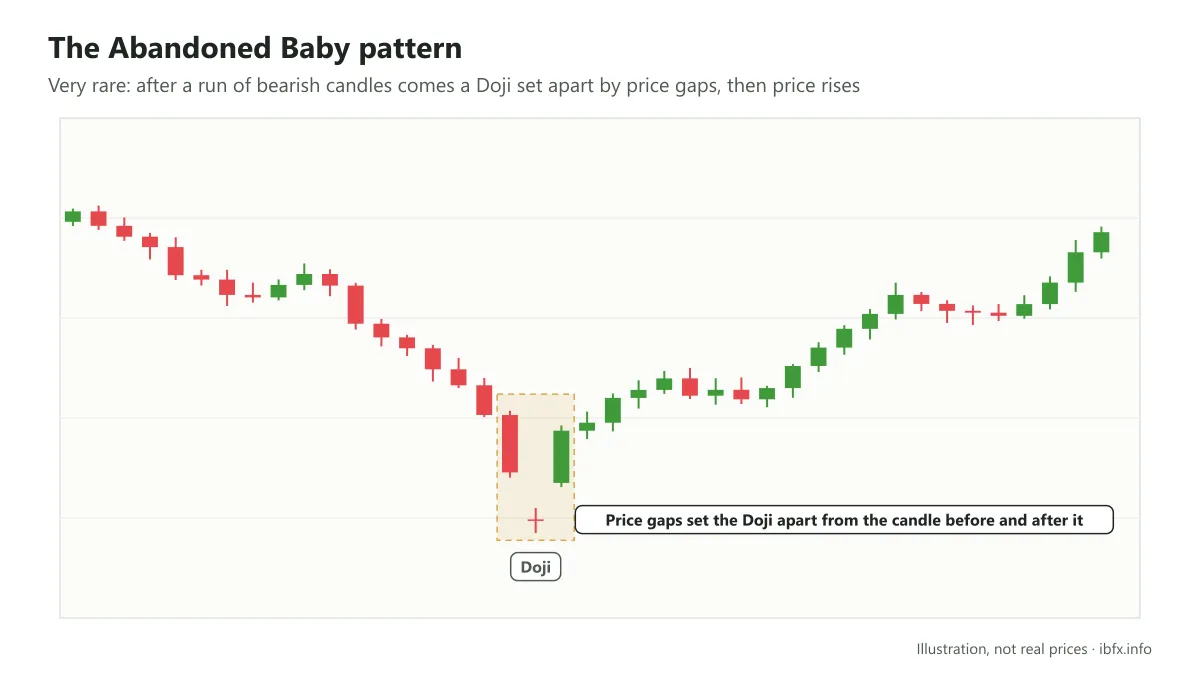
The abandoned baby reversal pattern shows up in a downtrend, after a run of bearish candles whose closes get lower and lower. It is a very rare kind of reversal pattern because it is made of a doji candle with gaps appearing against the candle before it and the candle standing after it.
The market at this point is in a falling trend with extremely strong selling pressure, which makes the candle of the first day a long red one; by the second day, though, the range between buying and selling is so narrow that the close ends up near the open, producing a doji candle along with a gap against the candle before it. On the third day a bullish candle with a long body appears, which creates one more gap in the opposite direction. And it is that upward gap on the third candle that completes the pattern, a signal that price may recover to higher levels. According to Bulkowski’s figures, this pattern points the right way in about 70% of cases. Because it needs a price gap on both sides, this pattern is extremely rare in forex.
Those are the 5 candlestick patterns you ought to know, because a great many traders use them. The four hit rates given above come from Bulkowski (the Morning Star has no figure in the source used for this article), and were compiled mainly on the US stock market, each source quoting them can differ, and they do not carry over unchanged to forex; no pattern is right every time, so always place a stop loss. You should also note that these patterns only work on the chart timeframe you are looking at: if you see them appear on m15 candles, for example, they will work within the M15 range, and price can rise or fall by a certain amount rather than as strongly as on larger timeframes. So keep this in mind, and you will know when you need to get out. See also: The important reversal candlestick patterns to know.