On this page
Whichever system you use, be it Price Action, Ichimoku or a few indicators put together into a trading system of your own, one of the key problems is finding the barriers, the areas where buyers and sellers fight it out.
Those contested areas help a trader see which side has the upper hand. Pick the right direction and the trade makes a profit; pick the wrong one and you have to cut the loss, and if you do not cut the loss you can blow up an account.
Each kind of barrier has its own particular character, rather like a fire alarm that warns a trader: the two sides could be locked in a hard struggle in this zone, so be careful and have a clear plan.
We will carry on by introducing you to one fire alarm that rings fairly loudly, and that is a little tangled like a spider’s web. If you get a firm grip on this alarm, it will do a good deal to warn you where the exits are, or to make you more careful. That is the pivot point.
What is a pivot point?
The pivot point is a technical analysis indicator used to identify the general trend of the market on different time frames. The pivot point itself is simply the average of the high, the low and the closing price of the previous trading day. On the next day, if price sits above the pivot point, in theory that shows bullish sentiment is at work, while if price sits below the pivot point it shows bearish sentiment. So you can see that the pivot point is worked out in order to identify the levels at which market sentiment may change from bullish to bearish and the other way round.
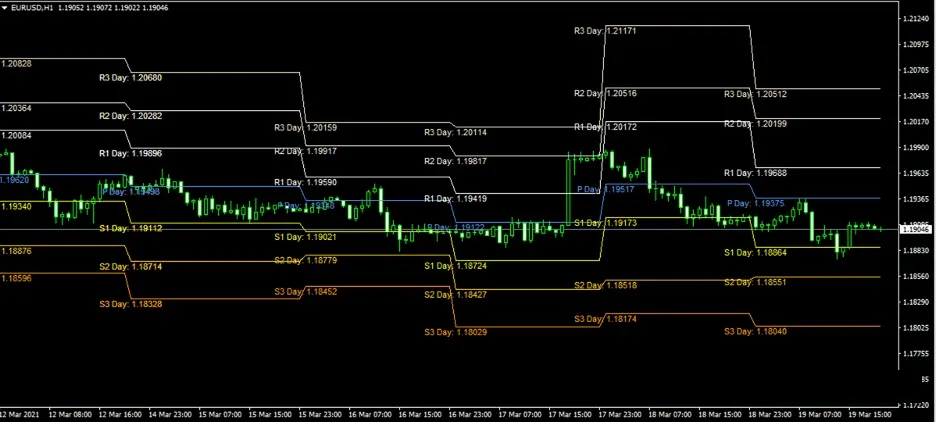
What a pivot point is made up of
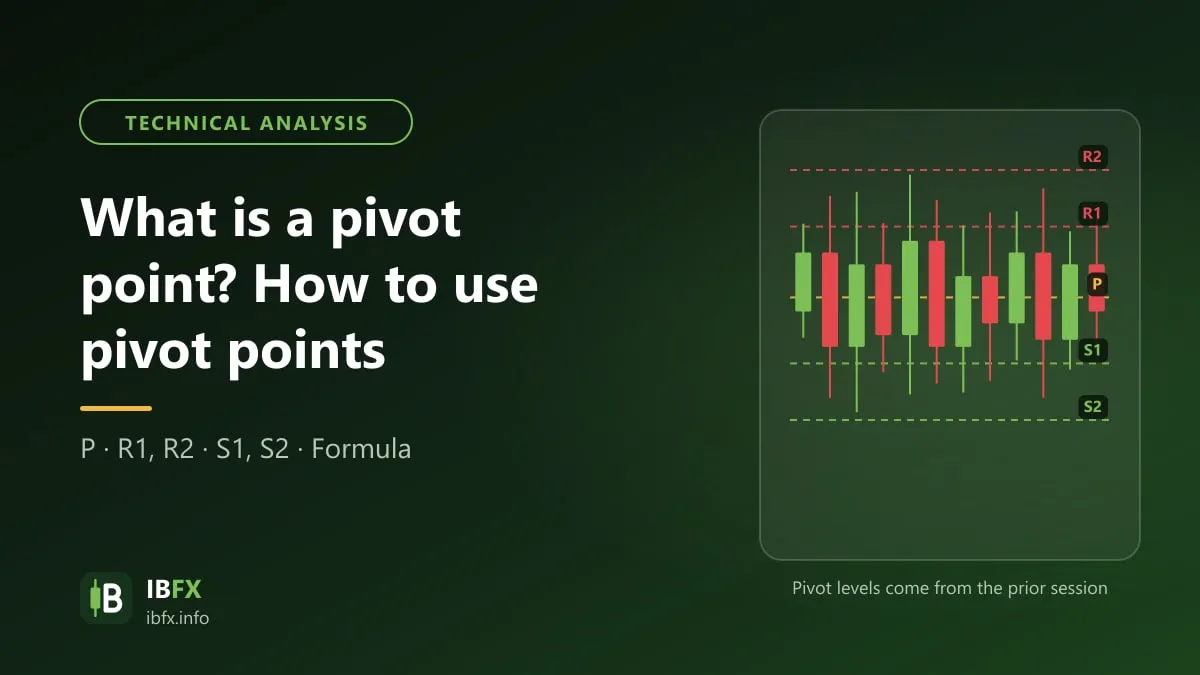
The pivot point has 7 lines in all: the main line, called the pivot line or the pivot point (PP); 3 lines above the pivot point, which are 3 resistance lines marked R1, R2 and R3 (R for Resistance); and 3 lines below the PP, which are 3 support lines marked S1, S2 and S3 (S for Support).
The formula for the pivot point
Before we look more closely at the formula for the pivot point, note one thing: the pivot point is very different from the EMA, the trendline and the support and resistance lines, in that the pivot point does not budge and is the same on every time frame smaller than a day.
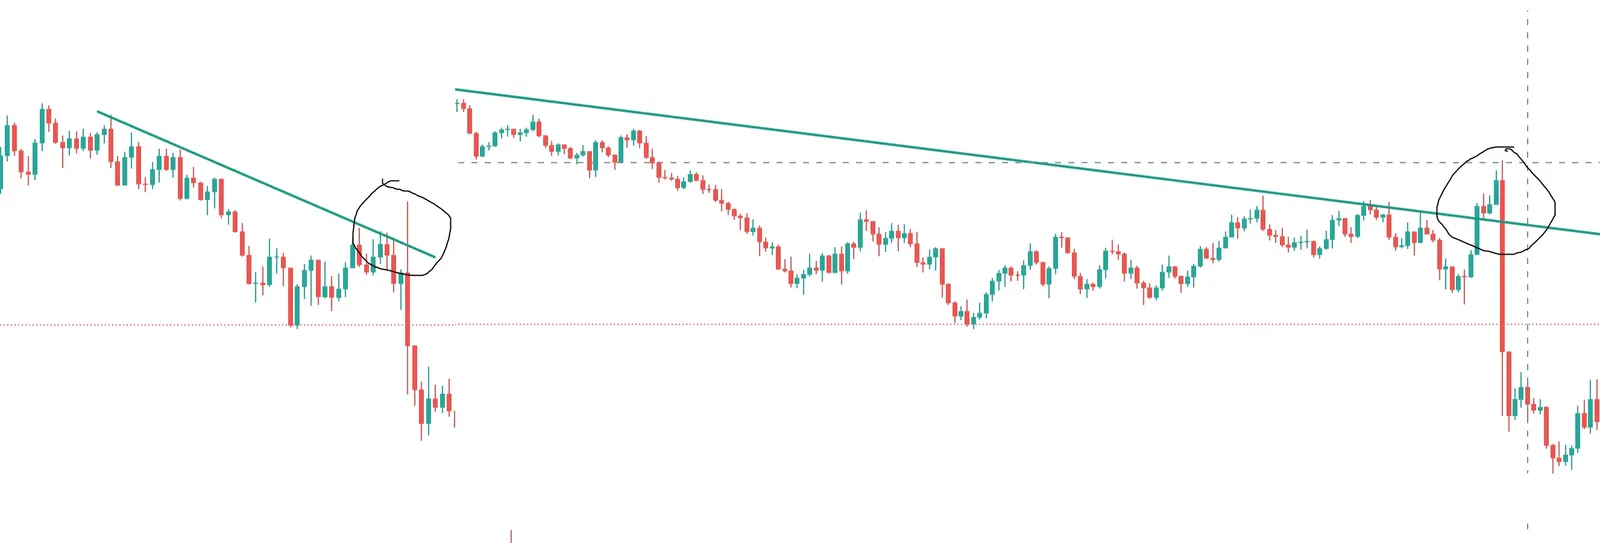
As in the image above, when you draw a trendline on a higher time frame such as D1 or W, price can move once you look at it on a lower time frame and may not sit entirely on that trendline.
With the pivot point (the daily kind), though, it does not shift at all and is always a static barrier, with exactly the same value on every time frame below the day. Note: because it is based on the high, the low and the close of the previous day according to the server, the pivot value can differ slightly from one broker or platform to another.
On top of that, the formula for the pivot point takes the high, the low and the closing price of the previous day to produce the R1, R2, R3, S1, S2, S3 levels and the pivot line for the chart of the following day.
That is what lets a trader stay close to the important levels through the trading day. Within that, the PP, or the main pivot point, is the most important price level of the day: it is the balance between buying force and selling force, or between the force pushing up and the force pushing down.
This shows that when price is higher than the pivot point, the market is seen as leaning to the upside, and the resistance levels R1, R2, R3 above it are the targets, the barrier zones price may meet.
The other way round, if price sits below the main pivot line, the market is taken to be leaning to the downside, and the support levels S1, S2, S3 below are the zones price may meet.
To get a clearer grip on this, follow the pivot point formula below:
Pivot point = [High (previous period) + Low (previous period) + Close (previous period)] / 3
Meanwhile the support levels, the S levels, are worked out as follows:
S1 = (2 x Pivot point) – High (previous period)
S2 = Pivot point – (R1 – S1)
S3 = Low (previous period) – 2 x (High (previous period) – Pivot point)
In the same way, the resistance levels are worked out as follows:
R1 = (2 x Pivot point) – Low (previous period)
R2 = (Pivot point – S1) + R1
R3 = High (previous period) + 2 x (Pivot point – Low (previous period))
If you look carefully at the formulas above, you will see that R1, R2, R3 and S1, S2, S3 all take the value of the P, the main pivot point, to work themselves out.
That is why the pivot point is the most important piece of the puzzle, rather like the “judge” that settles the R and S levels.
On top of that, because they are worked out from the high, the low and the close of the previous day, the stretches between R1 and R2, or R2 and R3, or S1 and S2 for example, are called the price ranges, or price zones.
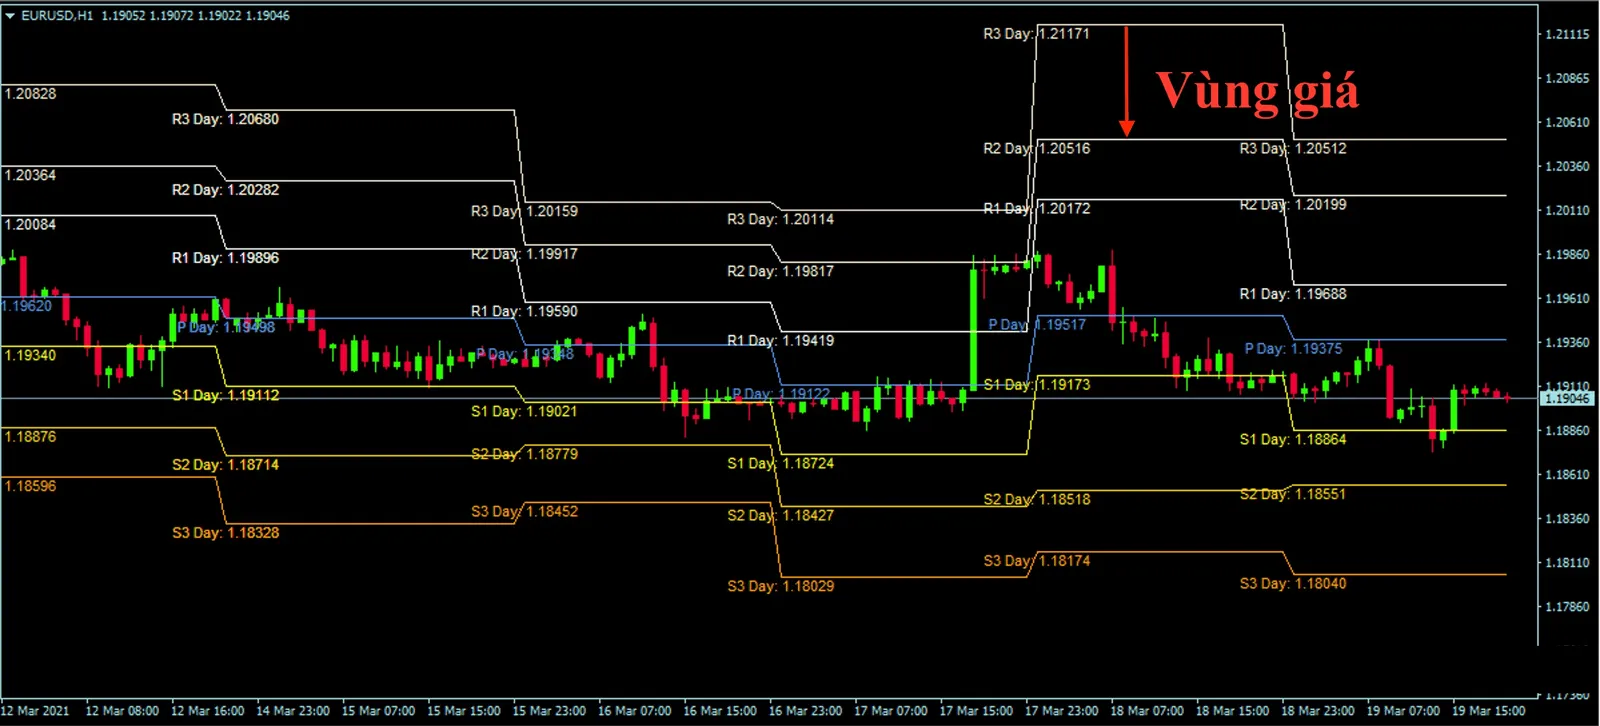
The screenshot shows the Vietnamese interface; the buttons and labels sit in the same places in the English version.
The wider the range of these values, the larger the distance between the levels on the next trading day. In the same way, the narrower the trading range, the tighter the distance between the levels on the following day.
How the PP relates to the R and S levels
The PP sits in the middle, at the center, and the R and S levels are worked out from it. Above it are the R zones, the resistance zones, and below it are the support zones, the S zones. Because of that arrangement, traders usually look at them in symmetrical pairs: R1 with S1, R2 with S2, and R3 with S3.
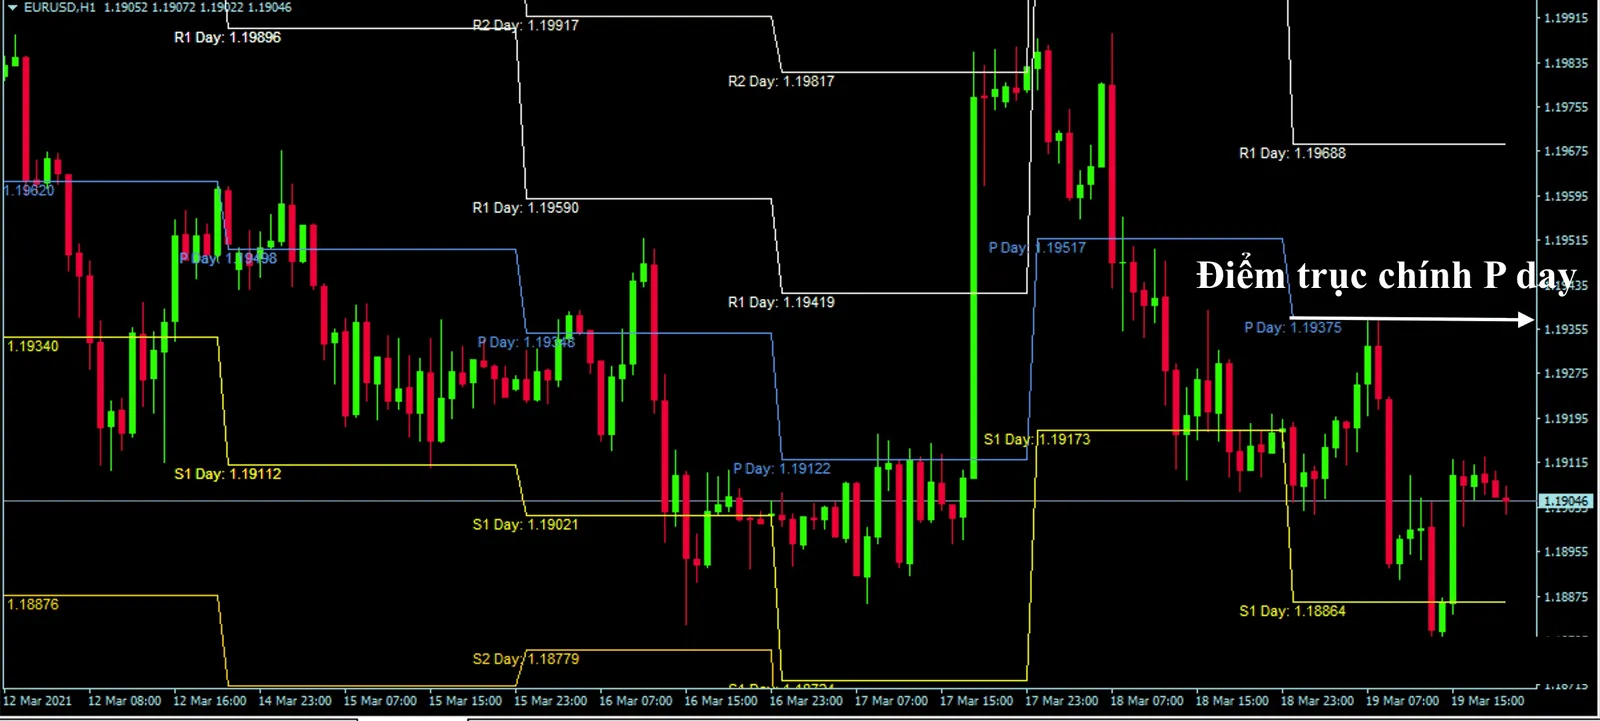
The screenshot shows the Vietnamese interface; the buttons and labels sit in the same places in the English version.
Of those, R1, the PP and S1 get the most attention: when price breaks the main pivot point, that is the key moment a trader watches before entering, and this move is described as price breaking the pivot line to head up to R1 or to move down to S1. That pivot line is not easy to break straight away, though; price will swing around it a good many times before it really breaks, and then heads for R, the resistance, or S, the support zone.
How is the pivot point different from Fibonacci?
Both are shown as support or resistance levels, or barriers as they are commonly called, but you can see that the pivot point is built from only 3 prices: the high, the low and the close.
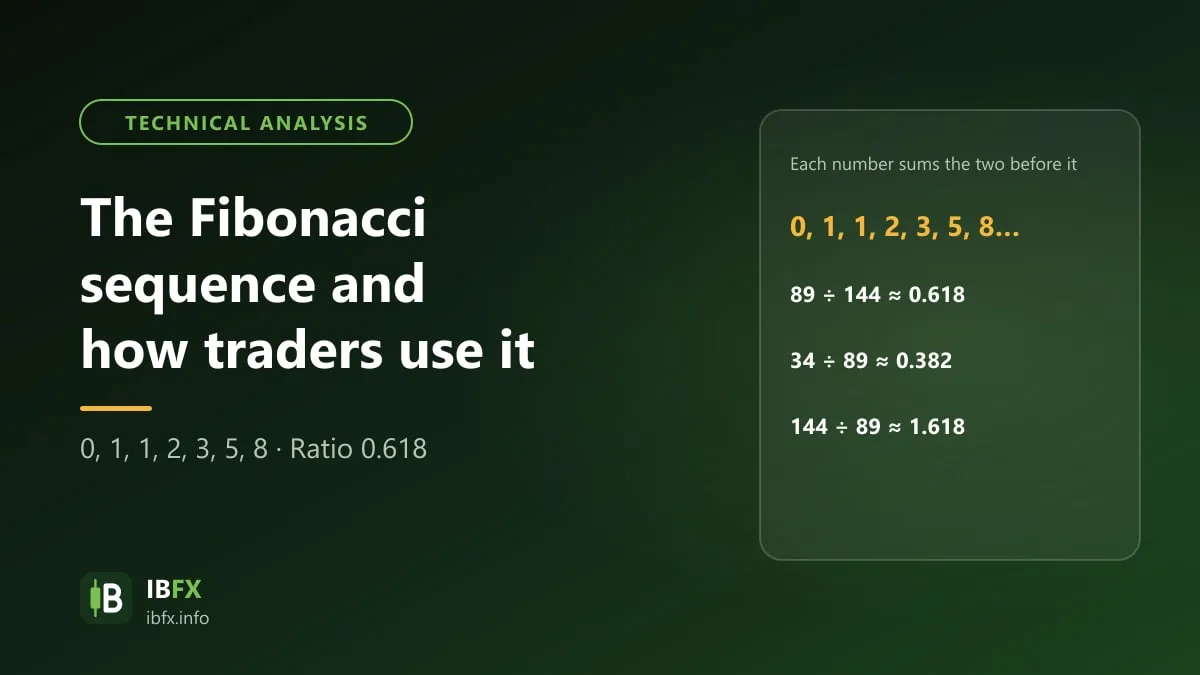
Fibonacci, meanwhile, is based on the fixed ratios the Fibonacci sequence itself produces, such as 0.382, 0.5, 0.618 and so on.
So each different way of working them out gives completely different results, and at the same time leads to a different way of trading.
MT4 does not come with a Pivot Point indicator. You can use TradingView, which has a “Pivot Points Standard” indicator built in, or look for an indicator in the official MQL5 library from MetaQuotes; avoid downloading an indicator file from an unknown source, because it can carry malware.
How to trade with the pivot point
In its nature the pivot point takes the main pivot line, the PP, as the marker, so that if price sits above the PP the market is seen as leaning to the upside. The most basic way of using the pivot point in trading is this:
- Price above the PP: give priority to BUY trades, with R1 and R2 as the targets
- Price below the PP: give priority to SELL trades, with S1 and S2 as the targets
- When price reaches the R or S levels: watch how price reacts (whether it bounces or breaks through) to take profit or to look for a new trade
Using this way on its own usually gives a lot of noisy signals, though. Instead, you can combine the pivot point with one of the following methods.
Combining the pivot point with reversal candlestick patterns
This way is simple and a lot of traders use it. Unlike moving barriers such as the EMA, which change with every candle, the S and R levels the pivot point produces are fixed on every time frame, so if a reversal candlestick pattern appears in exactly those areas and lines up with an R or an S, that is a good opportunity to enter a trade.
Let us look at the following example to make it clearer:
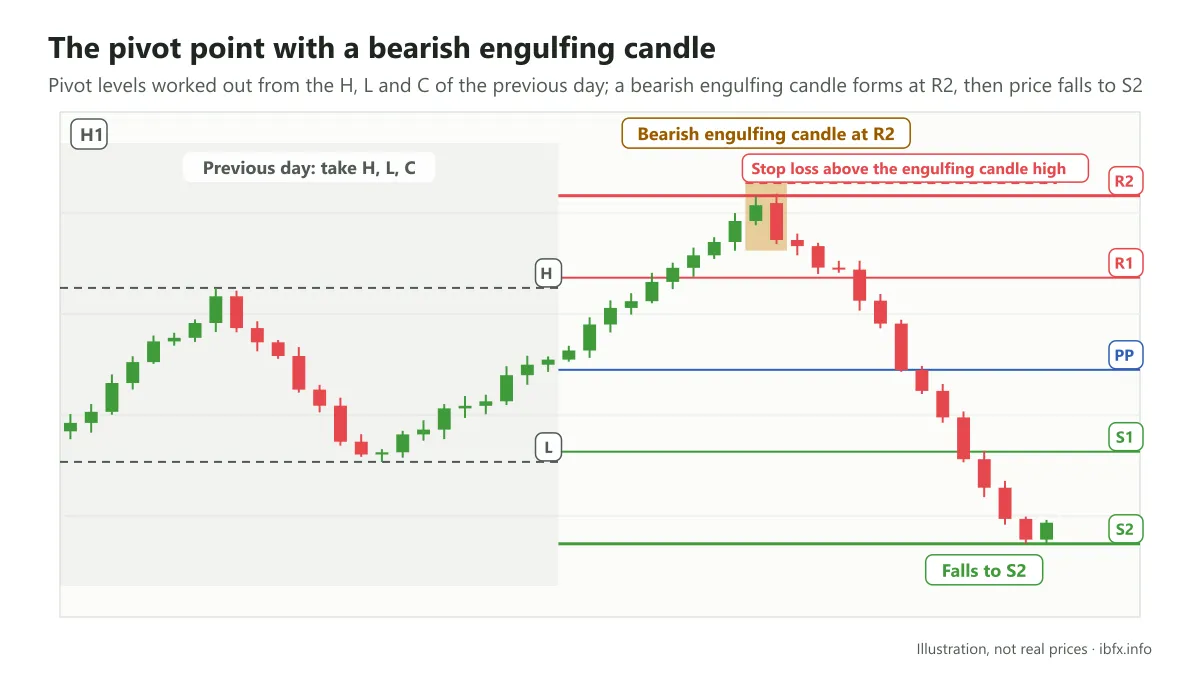
In the part I marked in yellow, a bearish engulfing pattern appeared just as price had reached up to R2, which reinforces the case that price could reverse and head down. In this example price then fell fairly sharply from R2 down to S2; a sensible stop loss sits above the high of the engulfing candle.
Combining the pivot point with the MACD
From the pivot point formula you can see that the pivot point is built on an average-price formula to look for the force of supply and demand, using 3 main prices: the high, the low and the close. That produces zones where the distance between them is what shows the strength of price. So combining it with a momentum indicator such as the MACD helps a trader pin down 2 main things:
- The buying and selling force of the two sides
- The point at which the trend reverses
What this means is looking for agreement between the pivot point and divergence or convergence in the MACD, or for price bouncing at exactly those R or S zones while the MACD shows the MACD line crossing the signal line.
On the subject of the MACD, you can have a look at our trading guide here:
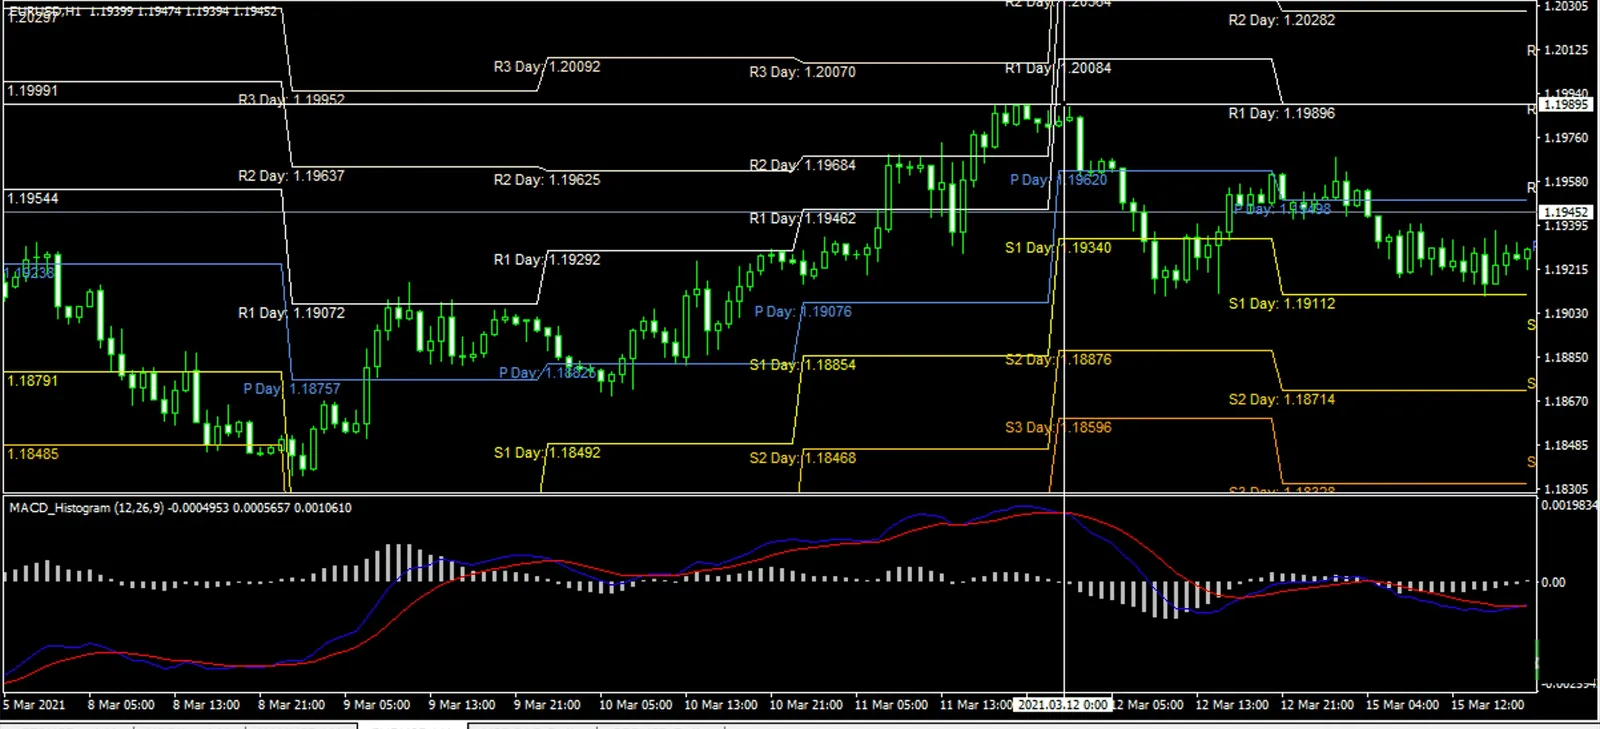
Just as in the example above, here you can also see that the moment the MACD line crossed the signal line was also the moment EURUSD reached up to R1. EURUSD then fell fairly sharply, down to S1.
Some points to note about the pivot point:
-
The pivot point levels are price zones that act as support and resistance levels. Because they are worked out in advance from the high, the low and the close of the previous period, the pivot levels are there from the start of the session and do not “chase” price the way the moving average indicators do, which makes them easy to use for planning during the day.
-
A pivot point is made up of the main pivot line, marked PP, along with three resistance levels above it (R1, R2 and R3) and three support levels below it (S1, S2 and S3).
-
Unlike the trendline and the EMA, the pivot point levels are always the same on every time frame smaller than a day, because only 1 formula is used to work them out. These pivot points are only valid for that day, though; the next day brings a different set of pivot levels, or, to put it more precisely, the R1, R2, R3 and S1, S2, S3 levels and the PP always change from day to day.
-
Like every other support and resistance zone, the pivot levels can be broken at any time, above all when strong news is out; always place a stop loss.