In trading, if you do not have a grip on the market trend, the chance of losing money is a great deal higher.
Understanding it and applying it is not a simple matter, but it is not so complicated that you have to be a genius to make sense of it.
Let us go through it together.
1. The definition of a market trend
By definition, the trend of a market, also called a market trend, is the tendency of a financial market to move in a particular direction over time. These trends are usually sorted into 3 kinds: the long-term trend on the long time frames, the medium-term trend on the middle time frames, and the short-term trend on the short time frames. So in terms of time it is fairly clear: a market trend comes in 3 forms, long-term, medium-term and short-term.
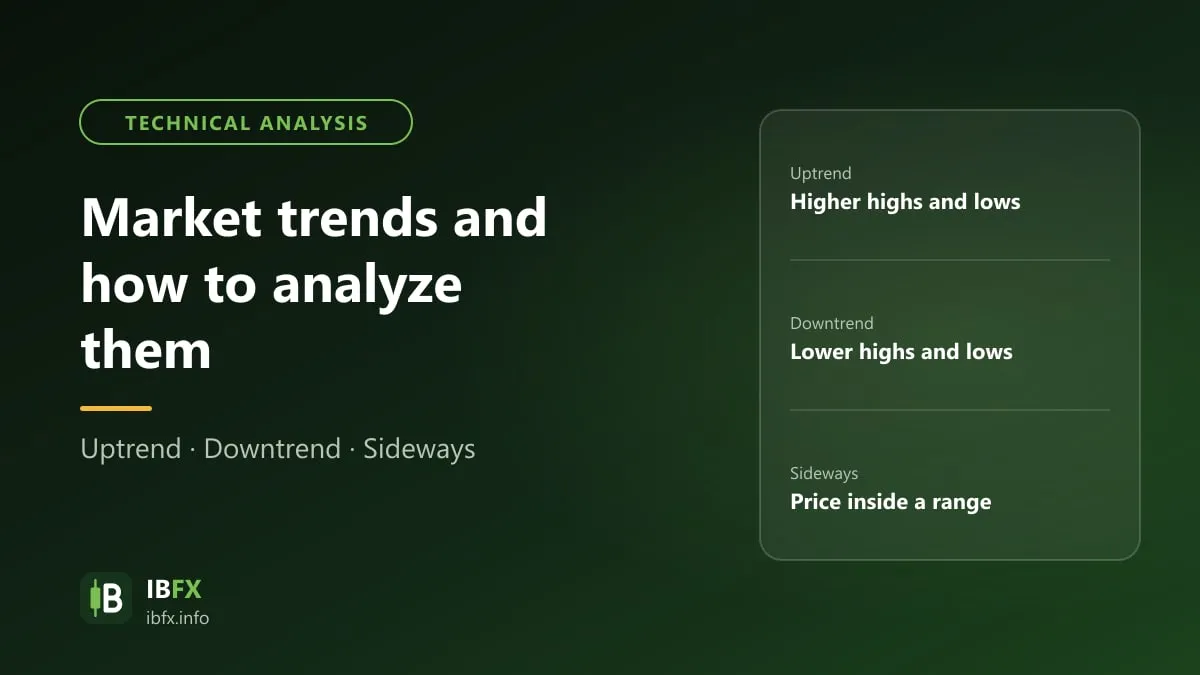
Traders usually identify the market trend with technical analysis: they read the structure of the highs and lows of price on a given time frame, together with the support and resistance levels. On one and the same asset, the trend on one time frame can differ from the trend on another.
Sorted instead by the direction price takes, market trends break down into the Bull market (an upward trend) and the Bear market (a downward trend). These 2 concepts are used widely in stocks, forex, commodities and many other markets. Read more: what a bull market and a bear market are.
2. The types of market trend
Over a given stretch of time, a market trend splits into 3 types:
The bull market
A bull market means a market in which price rises, which can be short-term or long-term. In stocks, a bull market usually goes with expectations of a brightening economy; with a currency pair, an uptrend means the first currency in the pair is strengthening against the second.
A bull market goes with growing investor confidence and money flowing into the asset. In stocks, a bull trend usually starts before the economy shows clear signs of recovering, because the market reflects expectations.
In short, in a bull market buying has the upper hand, which makes price rise.
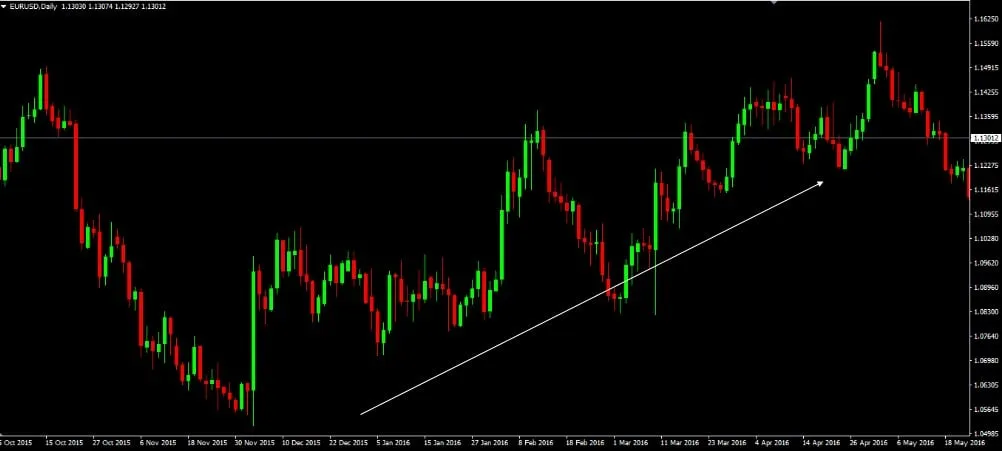
The picture below is an example of a bull market, that is, a market going up, on the EURUSD currency pair on the Daily time frame. You can see the green bullish candles rising hard over a fairly long stretch of time, which builds the upward trend on this EUR/USD pair.
The bear market
A bear market means a market in which price falls, which can be short-term or long-term. In stocks, a bear market usually goes with worries about a weakening economy; with a currency pair, a downtrend means the first currency in the pair is weakening against the second.
A bear market goes with fading investor confidence and money flowing out of the asset. In stocks, a bear trend usually starts before the economy shows clear signs of weakening.
In short, in a bear market selling has the upper hand, which makes price fall.
The picture below is an example of a bear market on the EURUSD currency pair on the Daily time frame. You can see the red bearish candles falling fairly hard over a long stretch of time, which builds the downward trend on this EUR/USD pair.
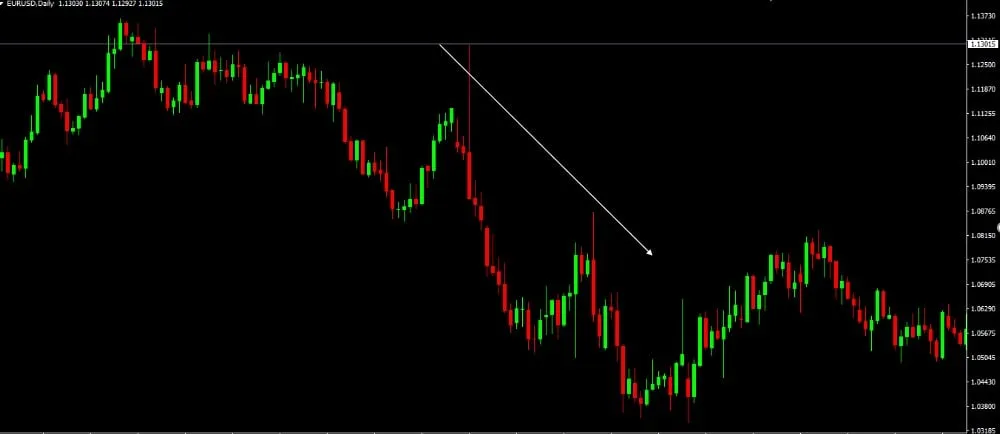
An example of a bear market, that is, a falling market, in real life.
The sideways market
Unlike a bull market and unlike a bear market, a sideways market is when price neither rises nor falls clearly and only swings inside a zone, which can be short-term or long-term.
A sideways market usually reflects hesitation: buying and selling are close to balanced, and investors are waiting for more information. This stretch often shows up after a strong rise or a strong fall.
In a sideways market, price goes up and down between the 2 levels of support and resistance, so some traders buy at support and sell at resistance. The range is usually narrow, though, so the profit on each trade is small, and false breaks happen very often; beginners should be careful. Read more: what a sideways market is.
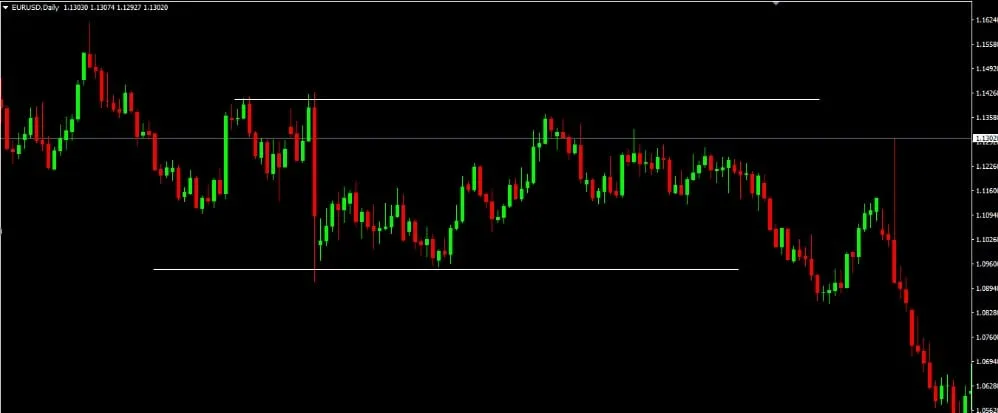
The picture below is an example of a sideways market on the EURUSD currency pair on the Daily time frame. You can see the exchange rate of this pair only going sideways between the support line below and the resistance line above, and doing so for a fairly long stretch of time.
Getting a grip on the market trend helps us trade against the trend less often and be ruled by our emotions less, which matters most for small retail investors. Read more on how to identify the trend: what a trend is, and how to identify the market trend.
Besides that, we should also watch the economic calendar to stay clear of the moments when the forex market moves hard on news, by following sites such as ForexFactory, investing.com, fxstreet.com…, because when important news comes out, price usually moves very hard in a very short space of time.