On this page
Fibonacci is one of the technical analysis tools traders know best in the financial markets in general and in forex in particular; every trader has at least heard of it or used it at some point in forex trading. Fibonacci comes in a great many forms, but the 3 that traders use most are: Fibonacci retracement, Fibonacci extension and the Fibonacci fan.
Carrying on the series on technical analysis, today we introduce Fibonacci retracement, a tool many traders use to find an entry or an exit in a market with a clear trend.
What Fibonacci retracement is
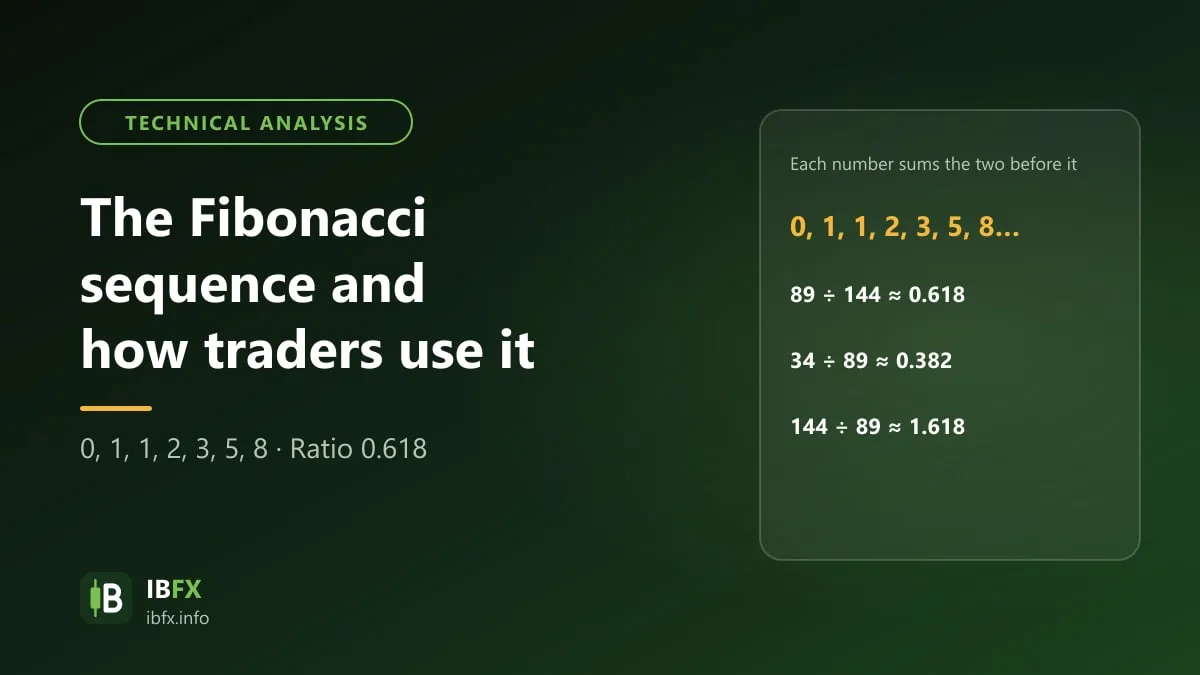
Before we get into the detail of how to use Fibonacci retracement, you should read through the article on what the Fibonacci sequence is, to get the most basic knowledge about this tool.
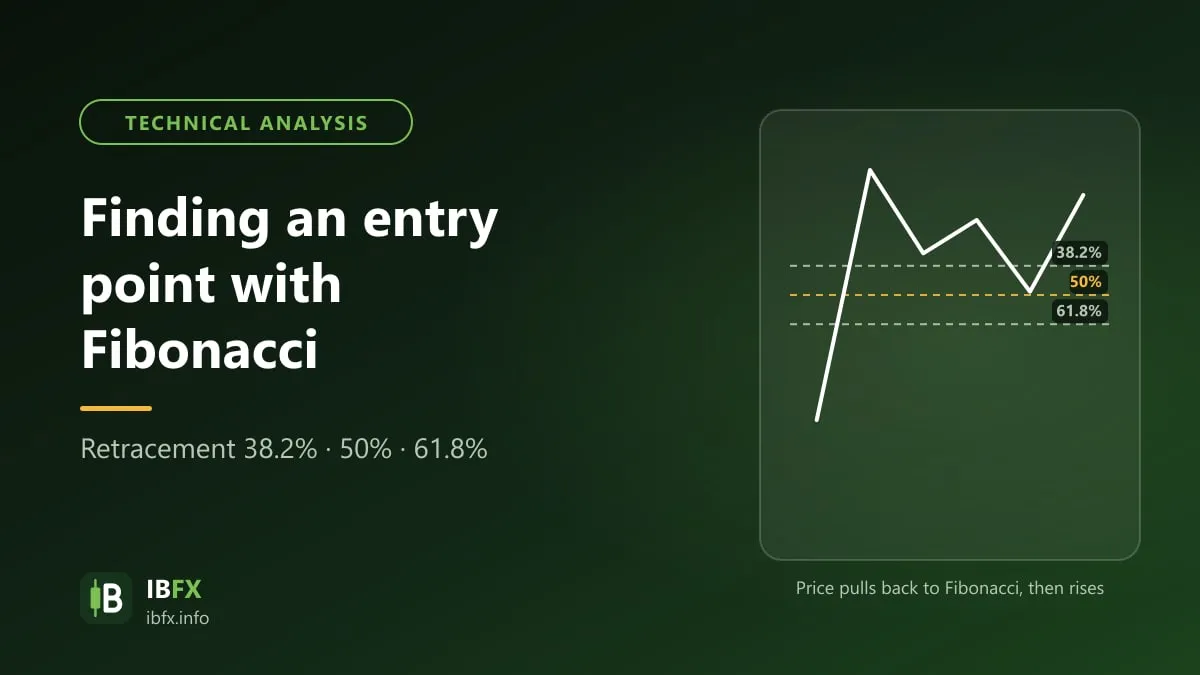
Fibonacci retracement is a tool that shows a trader where price may correct, or pull back, before it carries on with the trend it started in.
Follow the trend, or “the trend is your friend”, is probably the most classic line every trader hears in forex trading.
The reason is that a trend has a kind of momentum: once it has started moving it keeps going that way for a certain stretch of time, like a train — once the wheels are turning it drives straight on. So anyone who likes trading against it gets off lightly with a stop loss and badly by blowing up an account.
A train cannot keep driving forever; at some station it has to rest before the wheels turn again. A trend is the same. It cannot run in one go forever. Instead there have to be stretches where it pauses, or corrects: while it is rising there will be a stretch where it corrects lower and then rises again, and the other way round, while it is falling there are stretches where it recovers before it carries on falling.
So the question is: when these corrections happen, how far will price run, how deep will the correction go, and how does a trader work that out so as to watch those price zones and then take a trade? Fibonacci retracement is a tool that helps you estimate the answer to that question.
There are a great many ways to identify the market trend. If you do not know them yet, you can read what a trend is and how to identify the market trend and how to read a Japanese candlestick chart.
Which Fibonacci retracement level matters most?
Fibonacci retracement has these main levels: 0 – 23.6 – 38.2 – 50 – 61.8 – 76.4 – 100.
The levels pair up symmetrically, and each pair adds up to 100.
For example: 23.6 + 76.4 = 100, 38.2 + 61.8 = 100. (Many platforms use 78.6 in place of 76.4.)
Note that the 50 level here is not a number drawn from the Fibonacci sequence, but it is still built into Fibonacci retracement because price often corrects about half of the wave before it, and because a great many traders watch this level.
Among them, the 38.2%, 50% and 61.8% levels are the most important retracement levels.
As explained, price usually corrects back before it carries on with the old trend, and the 3 levels above are the ones most traders care about; they help you estimate how deep the correction runs before price carries on with the trend it started in.
Fibonacci retracement also only works well in a market with a clear trend. The plan many traders have ready is to buy at one of the Fibonacci levels (acting as support) when the market is in an uptrend, and to sell at one of the Fibonacci levels (acting as resistance) when the market is in a downtrend.
So what do these numbers mean?
Basically the barriers Fibonacci creates are treated as psychological barriers, so at these thresholds a trader gets a concrete view of what the buying side or the selling side is doing.
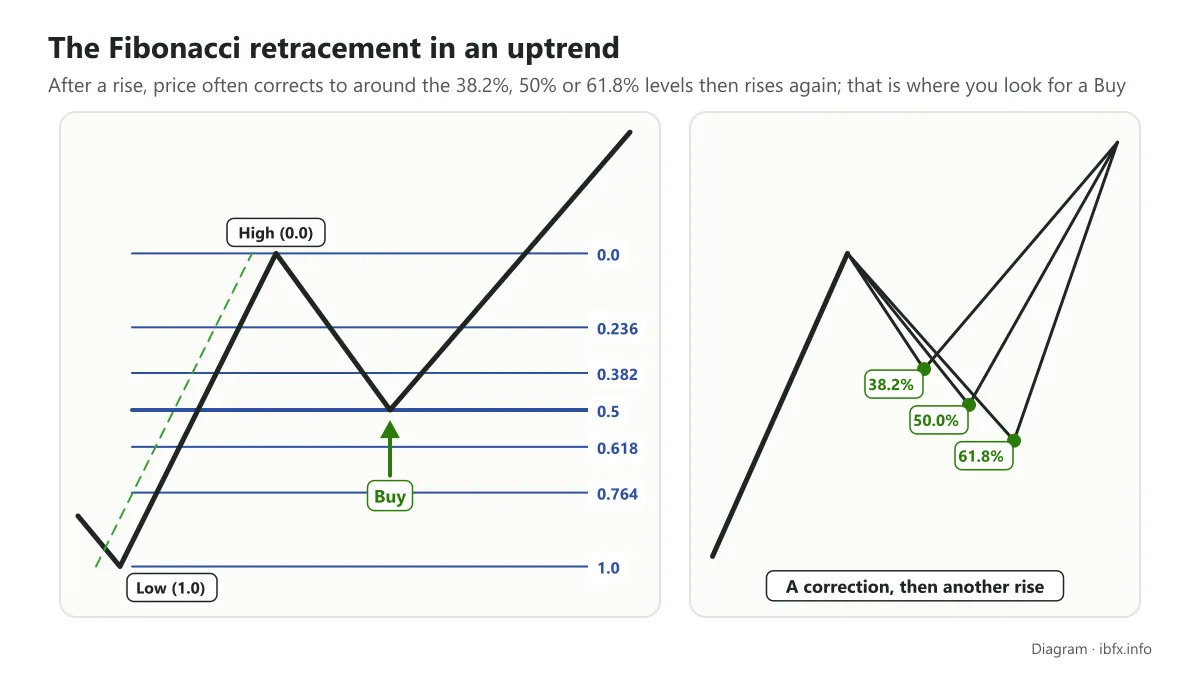
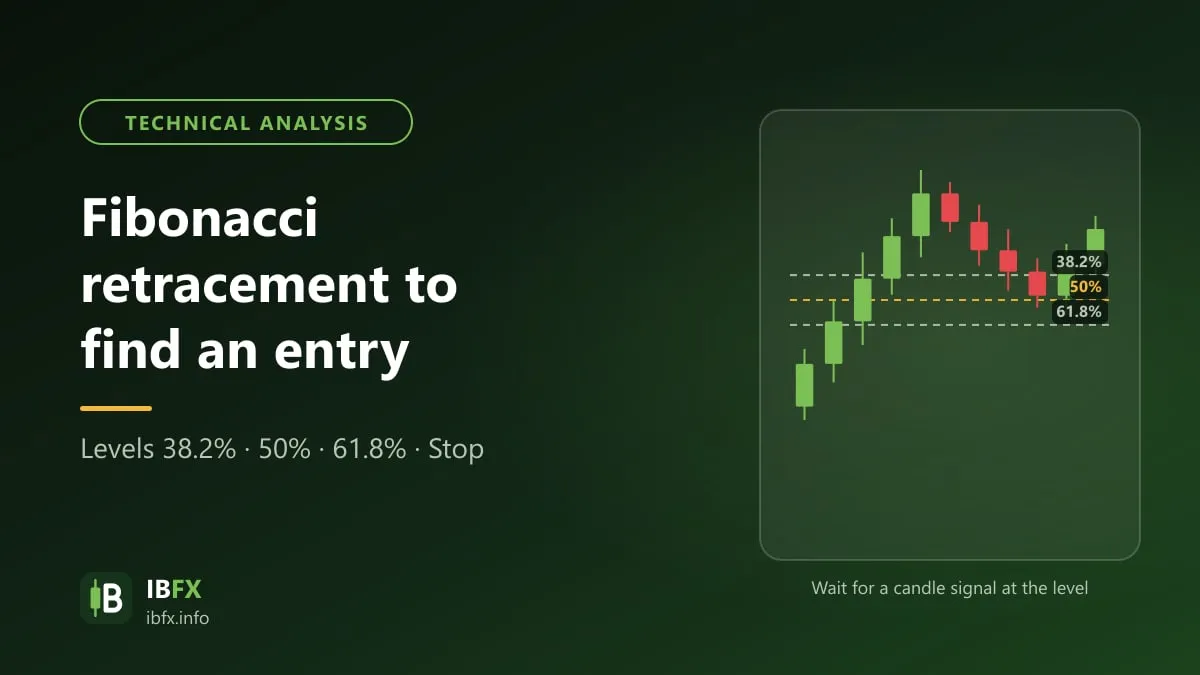
Look at the picture above and you will see that the main trend is an uptrend: once price has risen to this point it tends to correct, and only then carries on rising. And because the main trend is up, price may well come back to the 3 thresholds of 38.2%, 50% or 61.8%. Sometimes price can come back as far as 0.76, but trading at the 3 thresholds above is enough. If price really does come back to these points and gives a signal that it is bouncing, you can consider a “BUY”.
If you buy right in the zone circled in red, as in the example below, without waiting for the correction, you may be buying right at the high, and if the trend then reverses you very easily have to cut the loss.
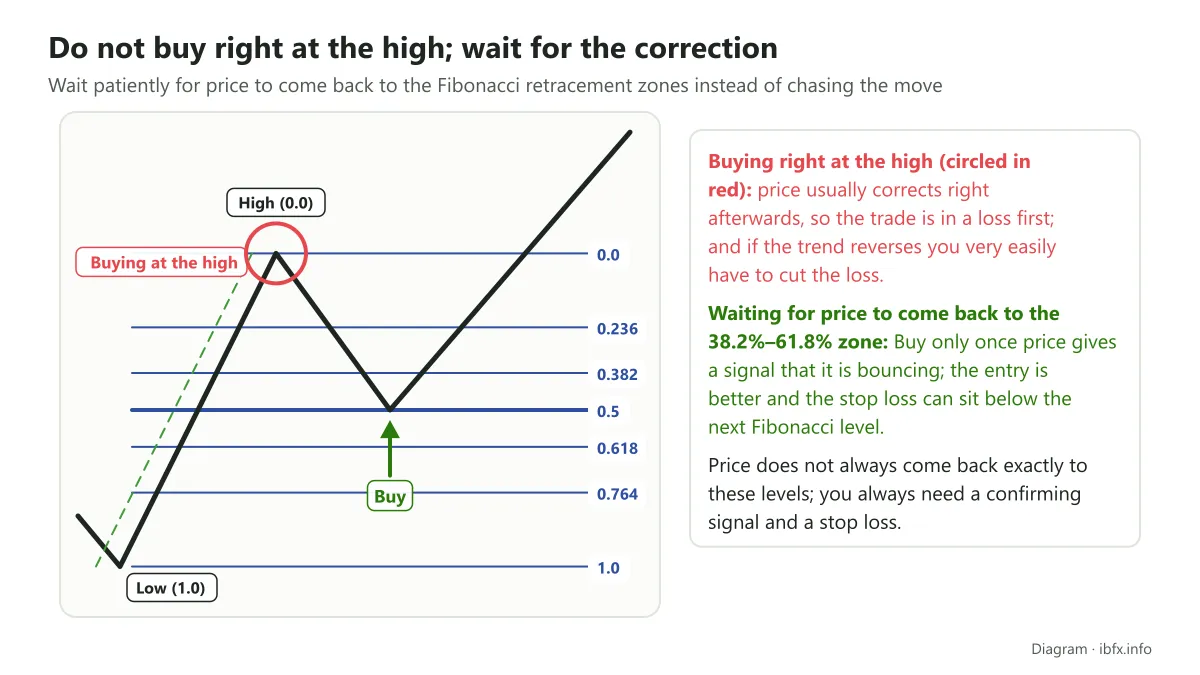
So waiting patiently for price to come back to the Fibonacci retracement zones is what you need to do.
The next example shows you what this looks like in a market in a downtrend.
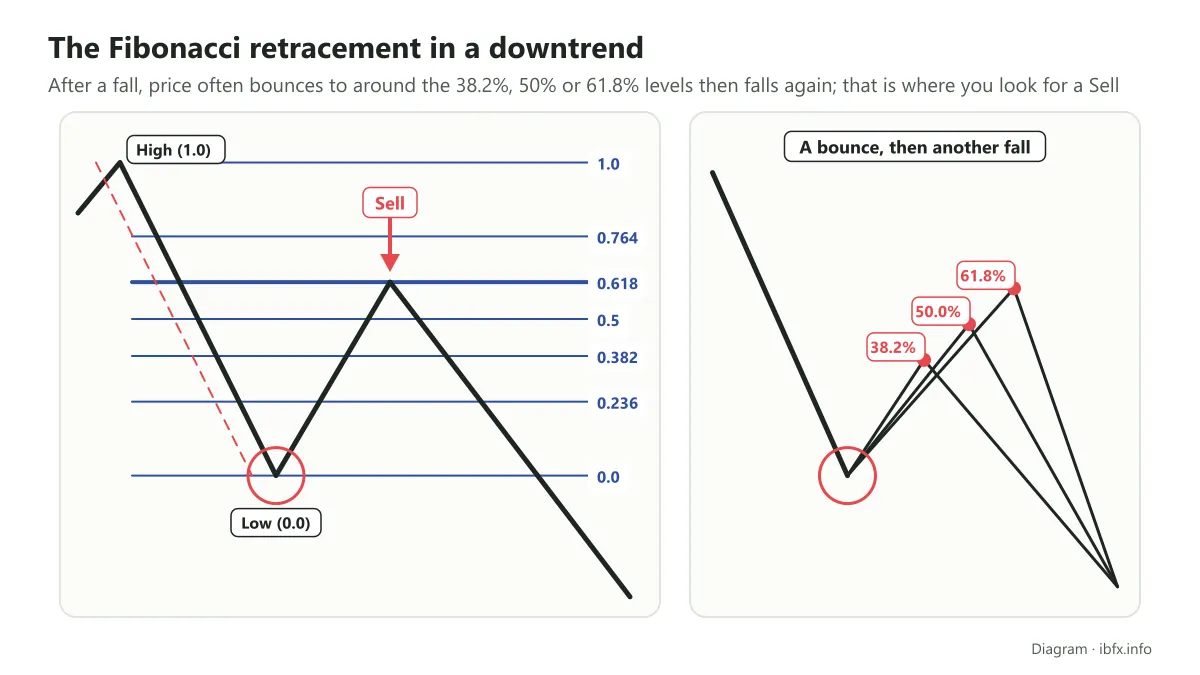
When a fall reaches the zones circled in red, price tends to rise again, that is, to bounce, and after that it falls once more. In the same way, after that fall price usually bounces at 3 points, and the most important ones for looking for an entry are 61.8%, 50% or 38.2%.
And at these points you can place Sell orders, then wait for price to fall further to take profit.
That is the basic way of reading how Fibonacci retracement is used.
Note that Fibonacci retracement only works well in a market with a clear trend. If the market is moving sideways, Fibonacci retracement does not give you much useful information.
How do you draw the Fibonacci retracement correctly?
This part shows you how to find the Fibonacci retracement tool on MT4 and TradingView, and how to draw it correctly. As said above, the first and most important thing when you use Fibonacci retracement is to identify which trend the currency pair, the gold, the share or the oil you want to analyze is in, and then use Fibonacci retracement to find the pullback, so as to enter or to exit.
Below we show you how to draw the Fibonacci retracement along the main trend, both the uptrend and the downtrend, and you can use the thresholds it creates to look for an entry. In a sideways market, Fibonacci retracement does not really work.
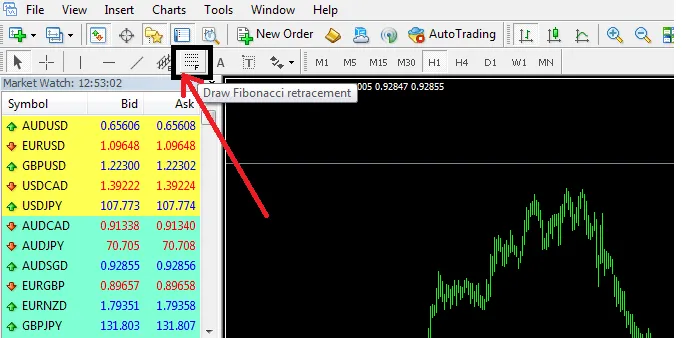
On MT4 you can click the Fibonacci retracement icon on the toolbar, as in the picture below:
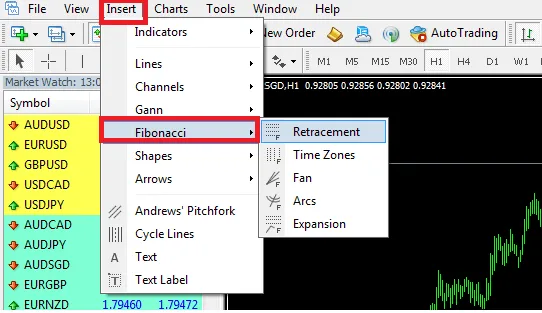
Or you can go to Insert → Objects → Fibonacci and pick Retracement (in some older versions it is Insert → Fibonacci → Retracement):
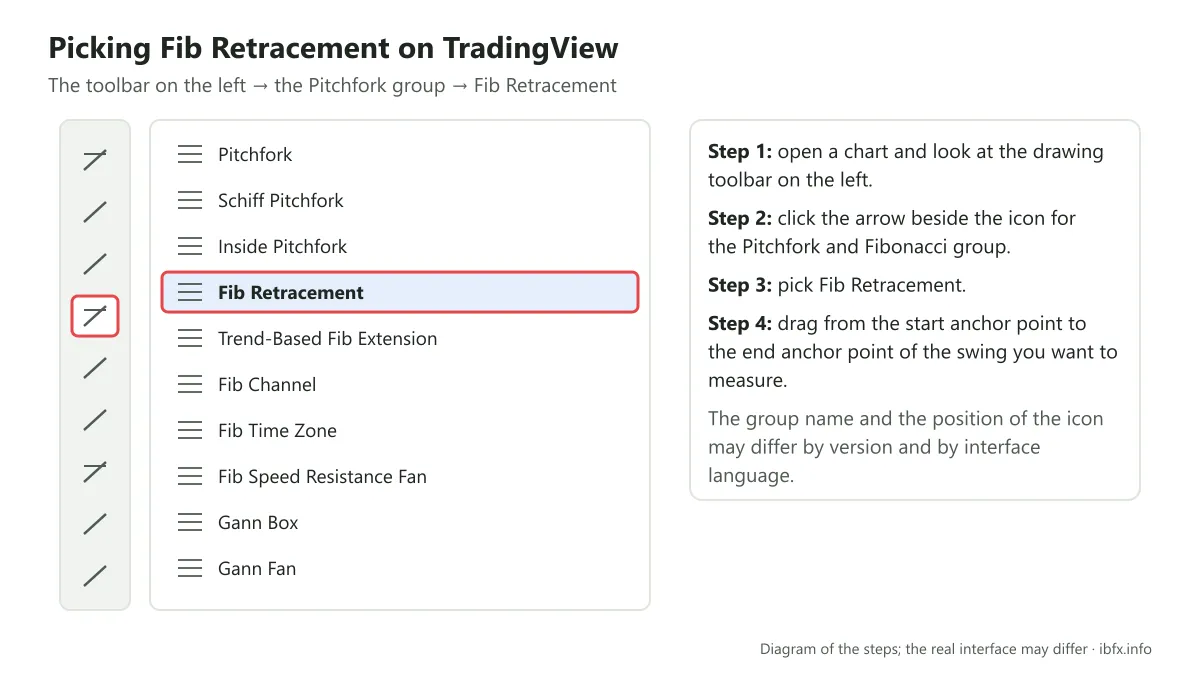
On TradingView, look at the left-hand side, find the “Pitchfork” group, click it and then pick Fib Retracement:
An uptrend
Drag the cursor from the lowest point to the highest point of a rising swing — those are the two anchor points — and the Fibonacci retracement is drawn like this:
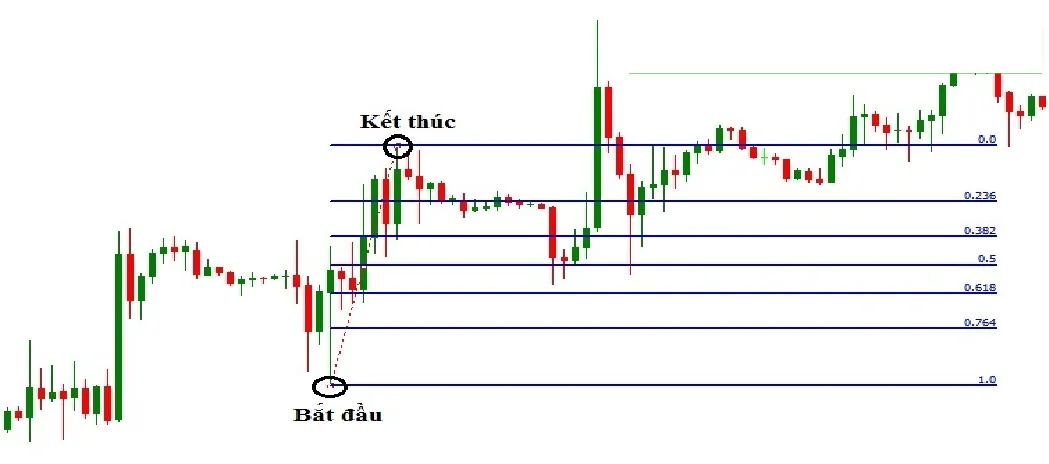
The screenshot shows the Vietnamese interface; the buttons and labels sit in the same places in the English version.
The basic Fibonacci retracement levels in an uptrend are 1.0 – 0.764 – 0.618 – 0.5 – 0.382 – 0.236 – 0.0, in order from the bottom up. Here 1.0 sits at the lowest point and 0.0 at the highest point of that rising swing. These are also called the Fibonacci levels.
The Fibonacci levels act as potential support. At the end of the correction lower, price may turn at one of these levels and carry on with the uptrend.
Of the 3 important levels above, the 0.5 and 0.618 levels usually get the most attention, though price can perfectly well turn at the others.
A downtrend
Drag the cursor from the highest point to the lowest point of the falling swing and the Fibonacci levels show on the chart as in the picture below:
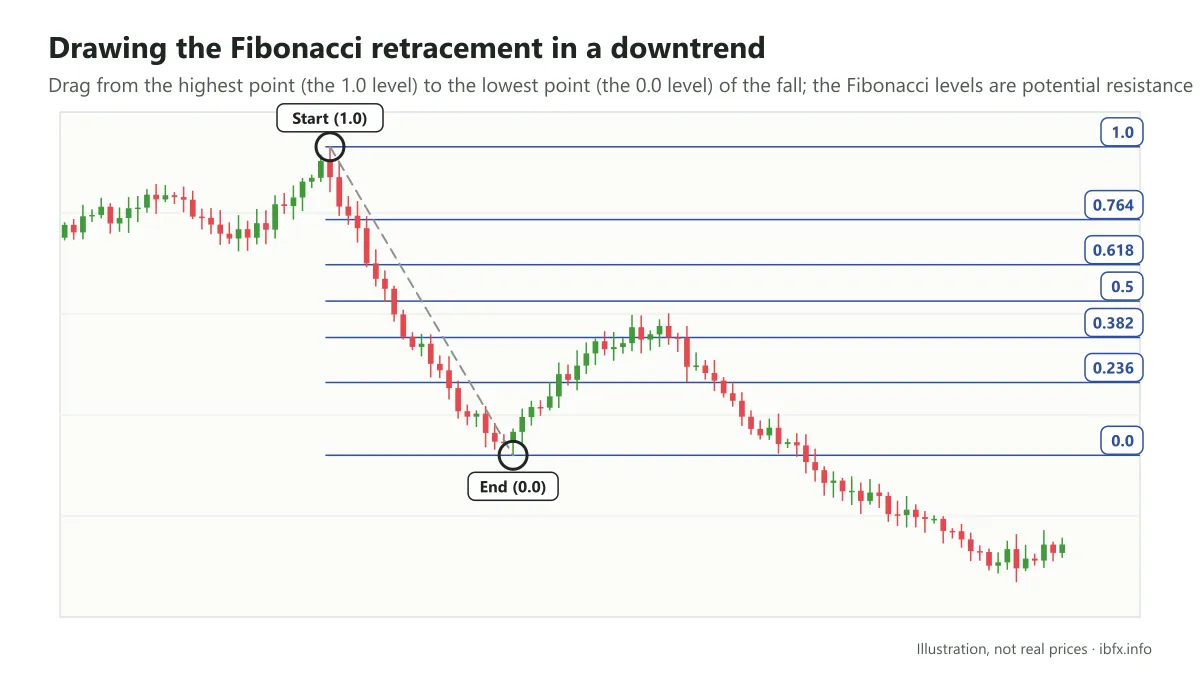
The Fibonacci levels of a downtrend work like those of an uptrend, but they are laid out from the top down: the 1.0 level sits at the highest point and the 0.0 level at the lowest point of the falling swing.
The other way round from an uptrend, the Fibonacci levels in a downtrend act as potential resistance. Price may carry on with the downtrend when it touches one of these levels after the correction higher.
Notice that the Fibonacci levels are symmetrical by nature, and that each symmetrical pair of levels (0.382 and 0.618, for instance) adds up to 1.
As with an uptrend, in a downtrend the 0.5 and 0.618 levels are still the 2 that get the most attention; when price bounces to these levels it may go back to the trend it started in. Here, that means price carries on falling (in a downtrend).
The steps for trading with Fibonacci retracement
There are 3 basic steps when you trade with Fibonacci retracement
- Step 1: identify the overall trend of the market
This step is simple, but it is the most important part of trading with this tool. As said, Fibonacci retracement only works when the market has a trend (up or down) and the trader only takes trades with the trend.
- If the market is rising, only look for a chance to take a Buy.
- If the market is falling, only take a trade when there is a Sell signal.
There are a great many ways to identify the overall trend of the market. The simplest is to look with your own eyes, but you need to zoom the chart out to get a broader view. The second way is to use trend tools such as the trendline, the price channel, or the crossover signals between moving averages…
- Step 2: draw the Fibonacci retracement
Once you have identified the trend, you draw the Fibonacci retracement.
- In an uptrend: wait for the market to start correcting lower, then draw the Fibonacci retracement over the most recent rising swing.
- In a downtrend: wait for the market to correct higher, then draw the Fibonacci retracement over the most recent falling swing.
You draw it the same way as in the guide above.
- Step 3: find the entry, and place the stop loss and the take profit
There are 2 ways to enter when you trade with Fibonacci retracement:
- Take a Buy or a Sell when price touches one of the important Fibonacci levels (it is safer to wait for one more confirming signal, such as a reversal candlestick pattern).
- Place a pending limit order (Buy Limit or Sell Limit) with the execution price at one of the important Fibonacci levels.
Put the stop loss at the lowest point of the rising swing, the swing low (for a Buy), or at the highest point of the falling swing, the swing high (for a Sell), and work out your position size from that distance.
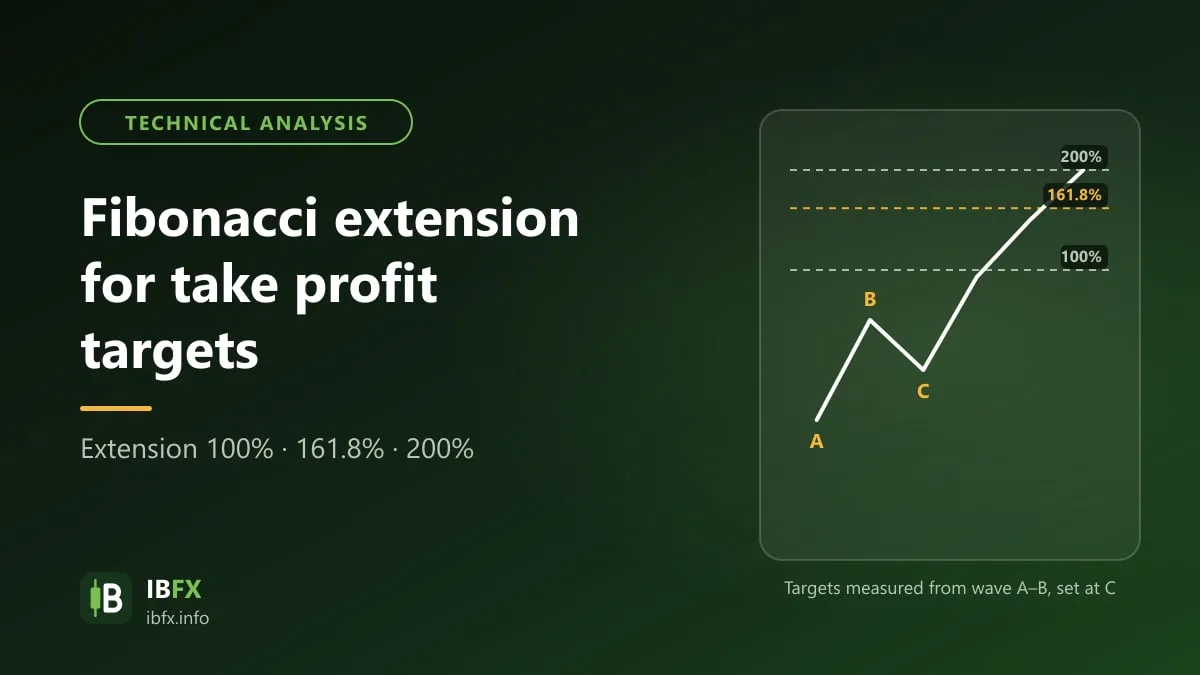
Take profit at the old high or the old low, or further out, so that the reward-to-risk ratio is good, ideally 2:1 or better. Note that taking profit exactly at the old high or low caps the reward-to-risk at about 1.618:1 (when you enter at the 0.618 level); to reach 2:1 you have to take profit beyond that old high or low. In the next article you will learn how to take profit with the Fibonacci extension tool when you trade with Fibonacci retracement.
An example of the steps for trading with Fibonacci retracement:
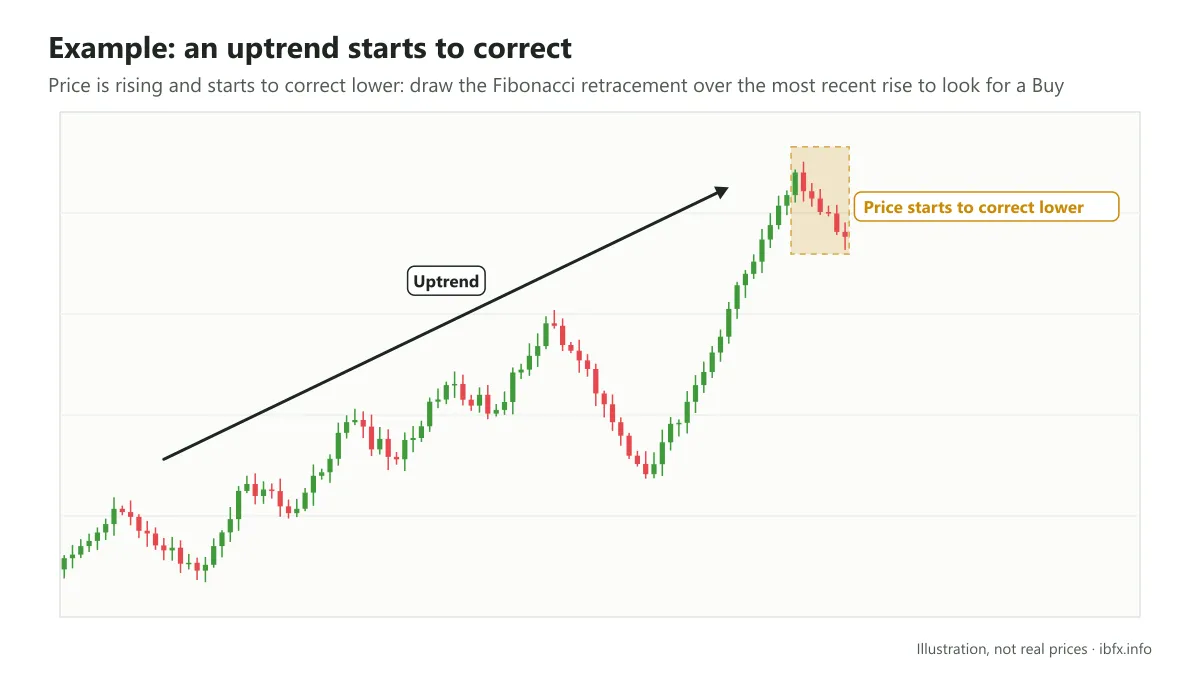
The picture above is a price chart on the D1 time frame. You can easily see that price is in an uptrend. At the moment we are looking at, price starts to correct lower. So now you draw the Fibonacci retracement over the rising swing right before that correction, to look for a Buy entry.
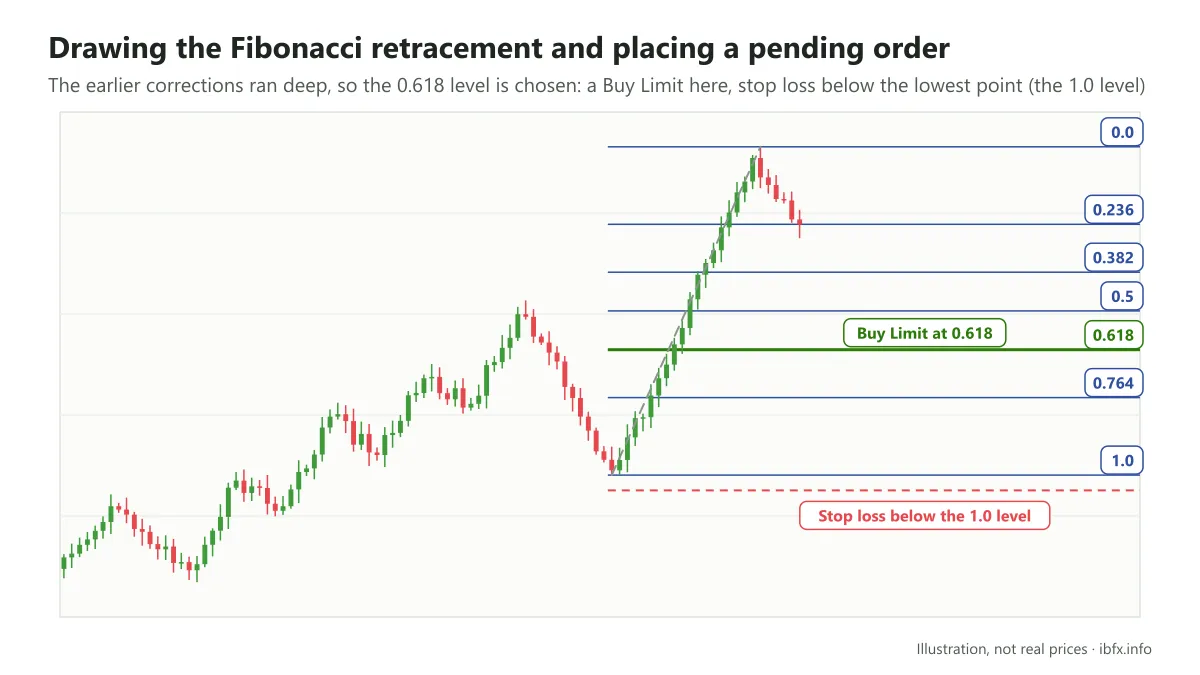
Once the Fibonacci retracement is drawn you can pick out a potential entry. In this case we see that the corrections lower run fairly deep, so we expect price to turn at the 0.618 level rather than at the 0.5 level. The reason not to pick 0.382 or 0.236 is that those levels give a poor reward-to-risk ratio.
Place a Buy Limit at the 0.618 level. Put the stop loss at the lowest point of the rising swing; or you can wait for price to touch the Fibonacci 0.618 level and then take the Buy, which works just as well.
And the result is…
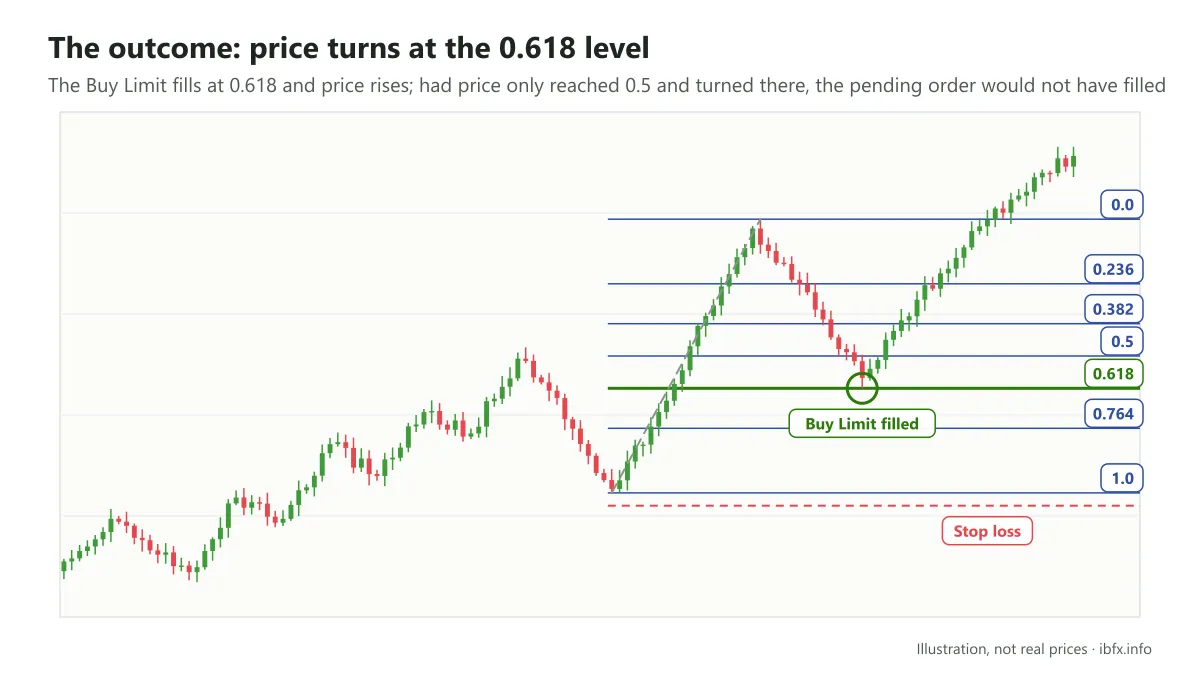
In this case we were quite lucky: price turned right at the 0.618 level. But suppose price had only reached 0.5 and turned there — the Buy Limit would not have been filled, and if we had been waiting for price to touch 0.618 before taking the Buy, we would have missed a chance at a large profit.
Although 0.5 and 0.618 are important retracement levels, there is nothing to say that price will not turn at others such as 0.382 or 0.236. That is why, if you trade with Fibonacci retracement on its own, it is very hard to work out which level to enter at.
In the next part of the article we introduce 3 other tools used alongside Fibonacci retracement to filter the entry better.
How to trade with Fibonacci retracement alongside other tools
As said, the Fibonacci retracement tool is more useful when it is used together with other tools, to find the level where several factors line up and the entry makes more sense.
There are 3 main tools you can combine with Fibonacci retracement:
- The trendline
- Support and resistance zones
- Reversal candlestick patterns
Fibonacci retracement together with a trendline
A trendline is a very simple tool for identifying the trend, and a very useful one. When the market is in a particular trend, the trendline acts as a barrier. That is, if the market is rising and price corrects lower and touches the trendline, price usually bounces; and the other way round in a falling market.
The idea behind this combination is that when price starts correcting lower or higher, if it touches one of the Fibonacci levels and at that same place touches the trendline, the odds of price turning to carry on with the overall trend it started in are usually higher.
Example: an uptrend on the D1 time frame
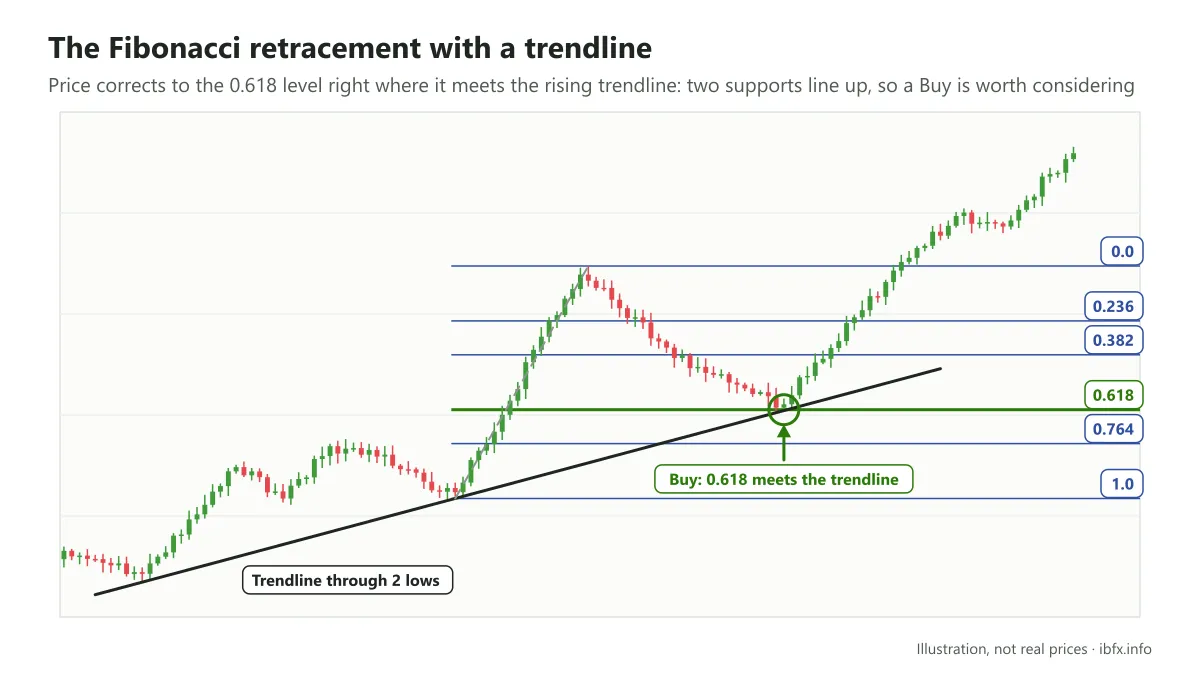
When price starts correcting lower you draw the Fibonacci retracement. The uptrend before it had made 2 lows, so you draw the trendline for that uptrend by joining those 2 lows together.
Your job now is to wait and see what price does. When price reaches the Fibonacci 0.618 level it meets the trendline, which at that moment is acting as support. With both conditions together you decide to take a Buy, and it turned out the way we hoped.
Example: USD/CAD on the D1 time frame
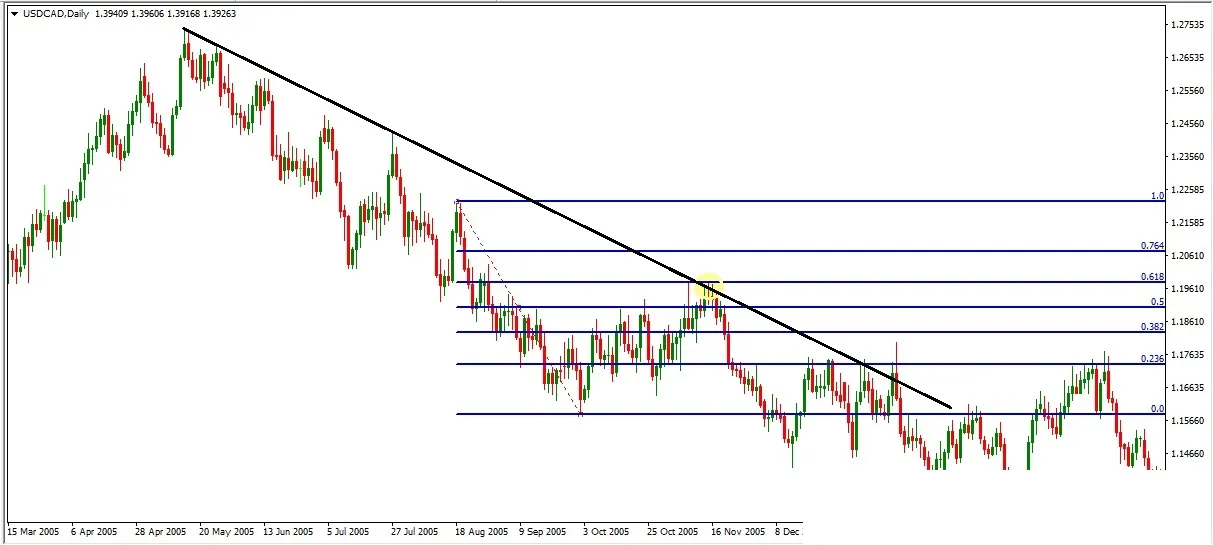
The overall trend of the market is clearly down: price keeps making lower highs, so you draw the trendline for this trend.
When price starts correcting higher you draw the Fibonacci retracement over the most recent falling swing and wait.
Price touches the trendline, which is acting as resistance, and that same place is the 0.618 level. Two factors line up, so this is a spot worth considering for a Sell (with the stop loss above the high of the falling swing), and the result in this example is what you see in the picture above.
Fibonacci retracement together with support and resistance zones
In an uptrend, if price meets support it goes up; the other way round, in a downtrend, if price meets resistance it goes down.
A price level counts as strong resistance or support if price has touched it many times and turned.
The idea here is basically the same as with the trendline, because a trendline acts as a barrier (support or resistance) for a particular trend. With this method, though, instead of using a trendline we watch the important price zones from earlier. If price reaches one of the Fibonacci levels and that level sits inside an important price zone from the past, price is more likely to react there, the correction ends and the market goes back to the trend it started in.
Example: USD/JPY on the D1 time frame
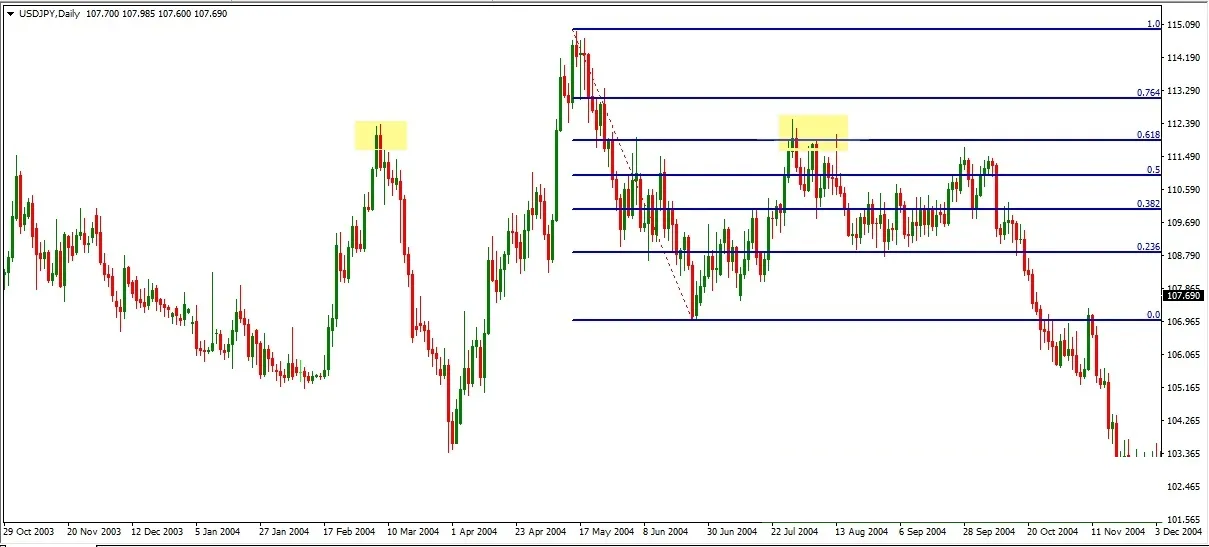
Of all the Fibonacci levels, 0.618 is the one that sits in an important price zone, because price had made a high in this zone earlier. So this counts as a resistance zone worth noting, where price may turn. The trading plan here is to wait for price to touch the 0.618 level and then take a Sell. And the result was that price turned and went back to the overall trend it started in.
Example: EUR/GBP on the H4 time frame
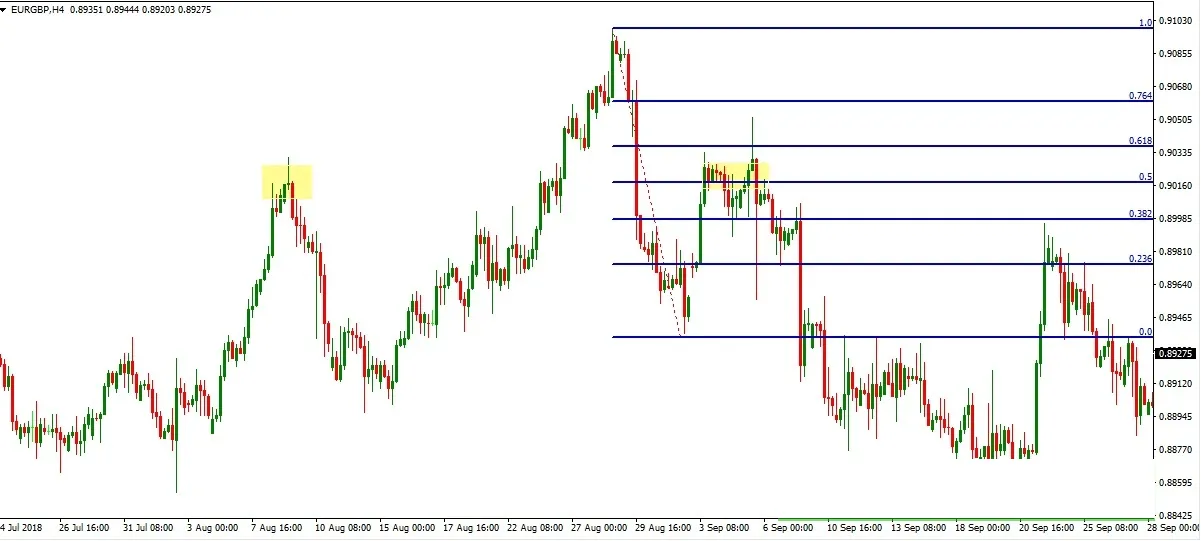
This case is quite like the example above. You can wait for price to touch the 0.5 level to take a Sell, or place a Sell Limit at that level.
Example: an uptrend on the H4 time frame
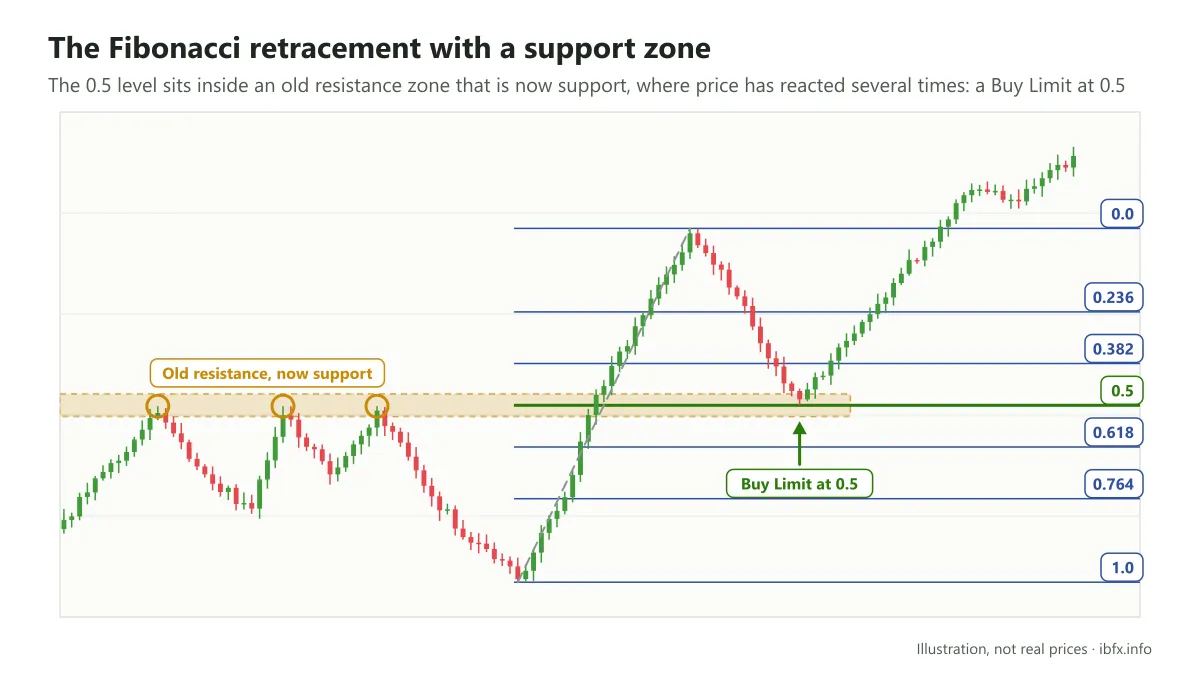
In this example the Fibonacci 0.5 level counts as a promising retracement level because it sits inside an old resistance zone that now acts as support; price has reacted several times on touching this price zone. You can place a Buy Limit at the price of the Fibonacci 0.5 level and wait to see what price does. The result was that price did indeed turn up at this level.
Fibonacci retracement together with reversal candlestick patterns
Reversal candlestick patterns are the candlestick patterns that give a signal that price is reversing the trend. They are one of the common tools of the price action school. Combined with Fibonacci retracement, a candlestick pattern helps confirm that price really is reacting at the level before you enter.
Example: a downtrend on the H4 time frame
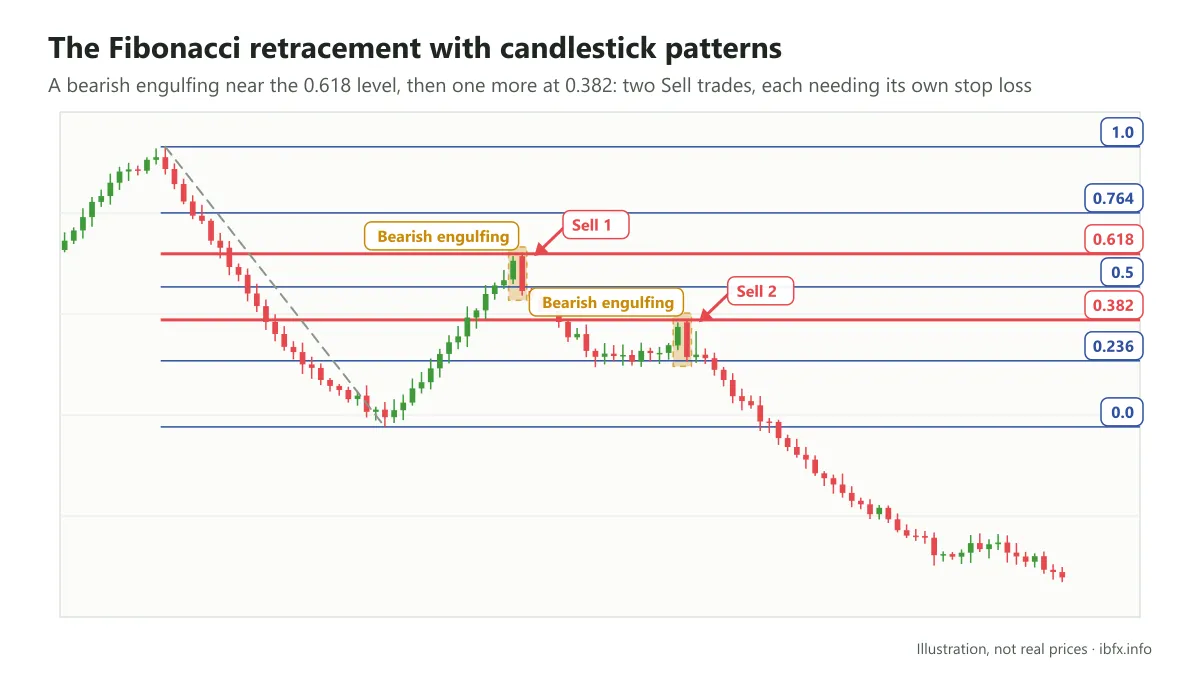
As price moves up toward the Fibonacci 0.618 level it forms a Bearish Engulfing pattern, a signal that price may turn lower. Price then tests the 0.382 level and forms one more Bearish Engulfing. In this example both Sell trades were in profit, but each one had to have its own stop loss.
The important reversal candlestick patterns are covered in detail in the article: the important reversal candlestick patterns to know in forex.
Example: a downtrend on the H4 time frame
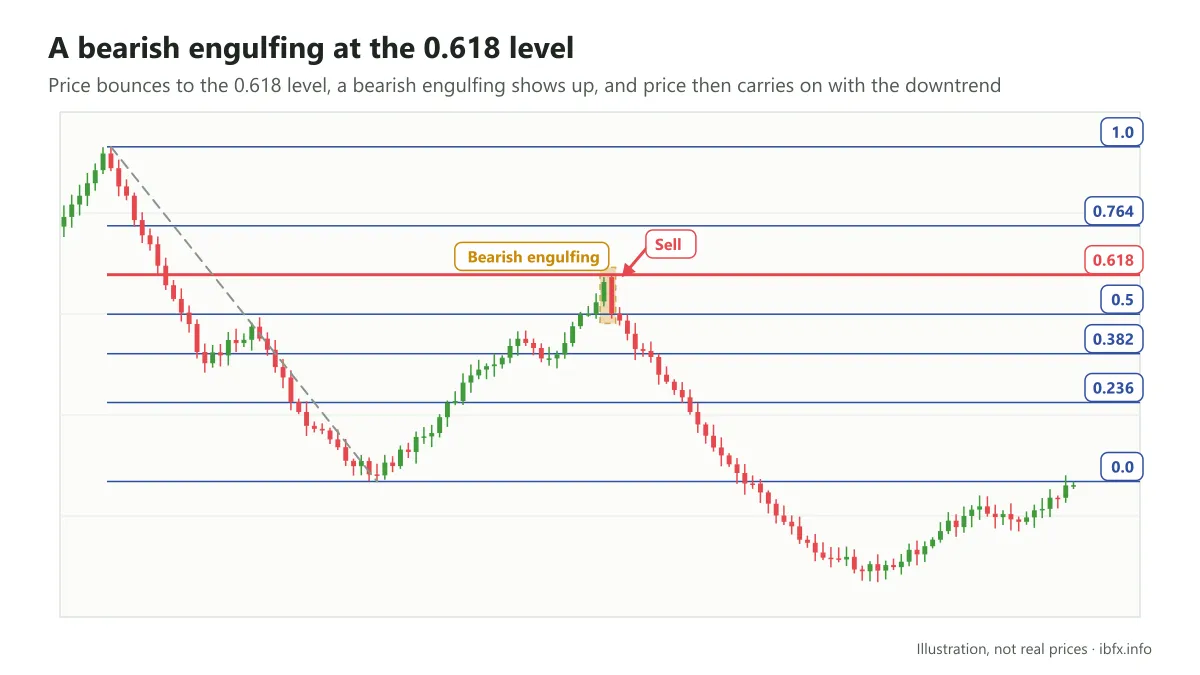
Example: another downtrend on the H4 time frame
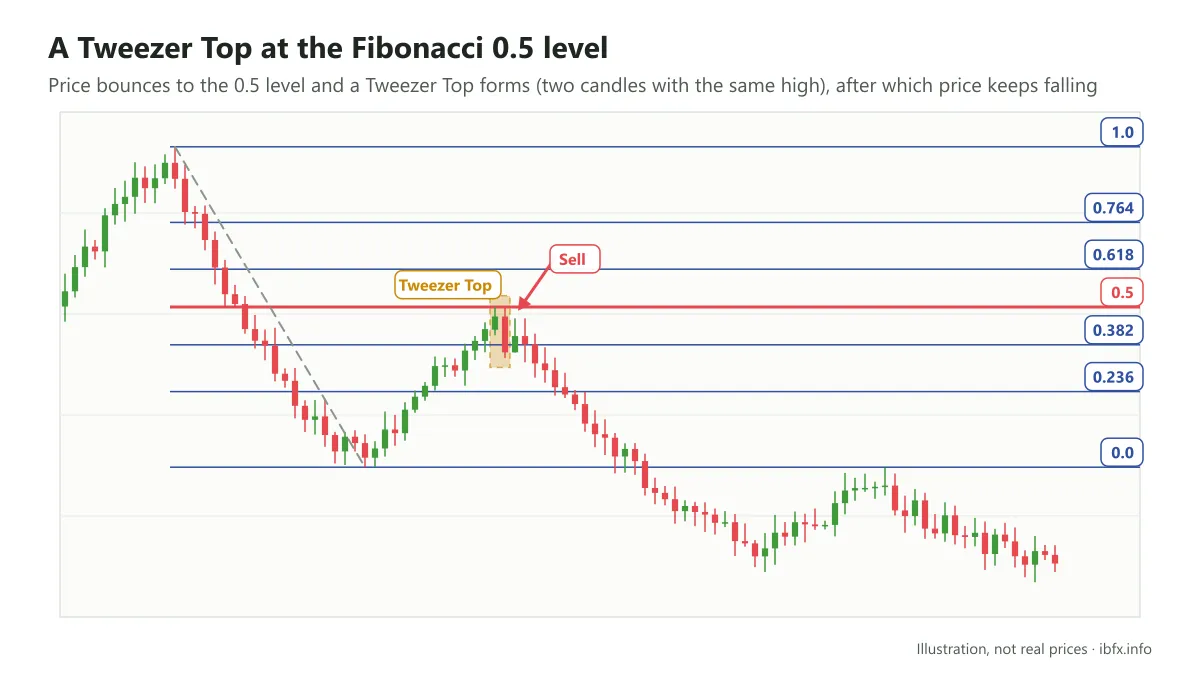
The Tweezer Top is a reversal pattern too; when it shows up at the Fibonacci 0.5 level, the signal that the correction higher may be over gets extra weight.
Example: an uptrend on the D1 time frame
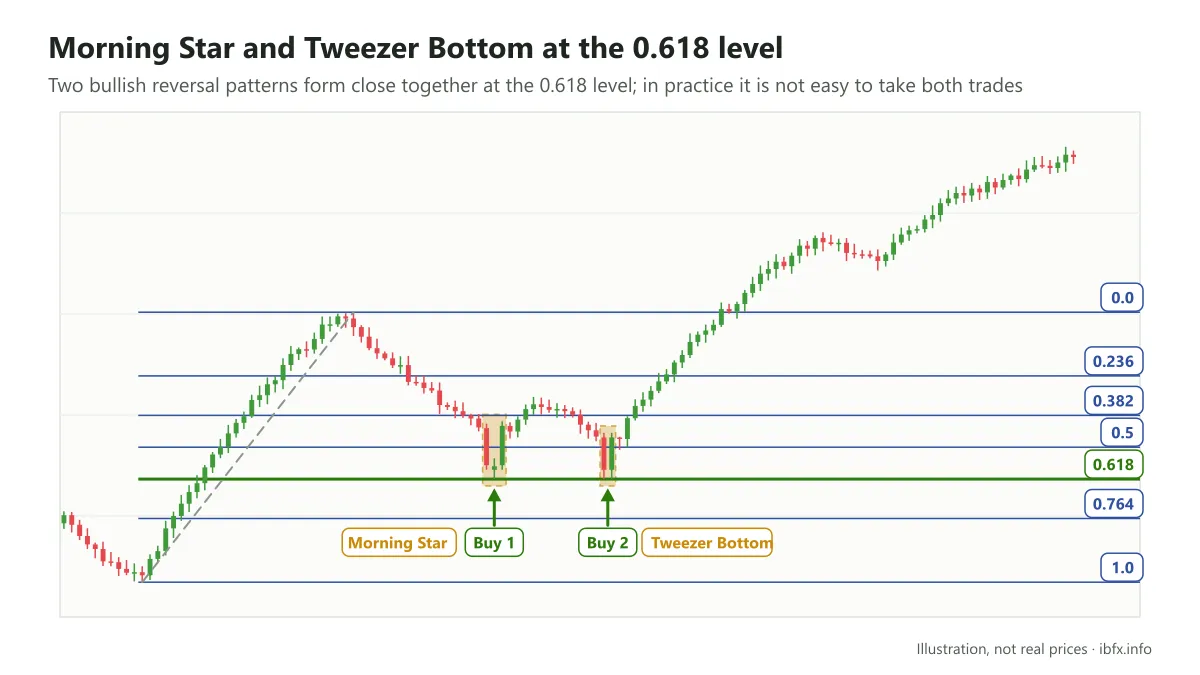
First, a Morning Star shows up at the Fibonacci 0.618 level, giving a good reversal signal. Price then retests this level once more with a Tweezer Bottom, giving another reversal signal. In this example, taking a Buy after each pattern would have left both trades in profit; but in practice the 2 patterns formed very close together, so taking both is not easy, and each trade needs its own stop loss. The example shows that combining Fibonacci retracement with reversal candlestick patterns helps you find entries with more behind them.
We hope this article leaves you with a clearer understanding of Fibonacci retracement, of how to draw it and of how to use it. What we have set out may not work in certain situations, but it is a base you can practice with in the market and build your own experience from.
In the next article we introduce Fibonacci extension, a tool for setting the take profit when you trade with Fibonacci retracement. You will then combine the 2 tools into one complete trading plan, with an entry, a stop loss and a take profit.
If you are just starting out, read what forex is: 101 basics to know and practice on a demo account before you trade for real.