On this page
To carry on the series of articles about indicators, this time the article introduces one of the indicators that belong to the group used to identify the trend – the Parabolic SAR. What is special about the Parabolic SAR is that although it is filed under trend indicators, its main job is to mark the moment a trend may be ending, which gives a trader a sensible place to close the trade.
Let us look at the Parabolic SAR in detail, at how it is worked out, what it means and how to trade with it.
What the Parabolic SAR indicator is, and the formula
What is the Parabolic SAR?
The full name of the Parabolic SAR is Parabolic Stop And Reverse, in which Parabolic means “shaped like a parabola” and Stop And Reverse means exactly that, “stop and turn around”. The name alone already carries both the shape and the job of this indicator. The Parabolic SAR is an indicator shaped like a parabolic curve, whose job is to mark the moment a trend ends and price turns into a new one.
The Parabolic SAR was developed by J. Welles Wilder Jr, the same man who invented a string of other well-known technical analysis indicators such as the RSI, the ATR and the ADX. He introduced the Parabolic SAR for the first time in 1978, in the book “New Concepts in Technical Trading Systems”.
The Parabolic SAR indicator is used to identify the current trend of the market, the potential entry points and a sensible moment to close a trade. With all 3 of those jobs, the Parabolic SAR can be regarded as a complete trading system. The job it is used for most, however, is marking the exit (trailing the stop loss along with the trend), so traders usually combine the Parabolic SAR with other tools and rarely use it on its own. In a sideways market in particular, PSAR keeps flipping from one side of price to the other and gives a great many false signals.
The Parabolic SAR indicator is shortened to PSAR.
The formula for the Parabolic SAR indicator
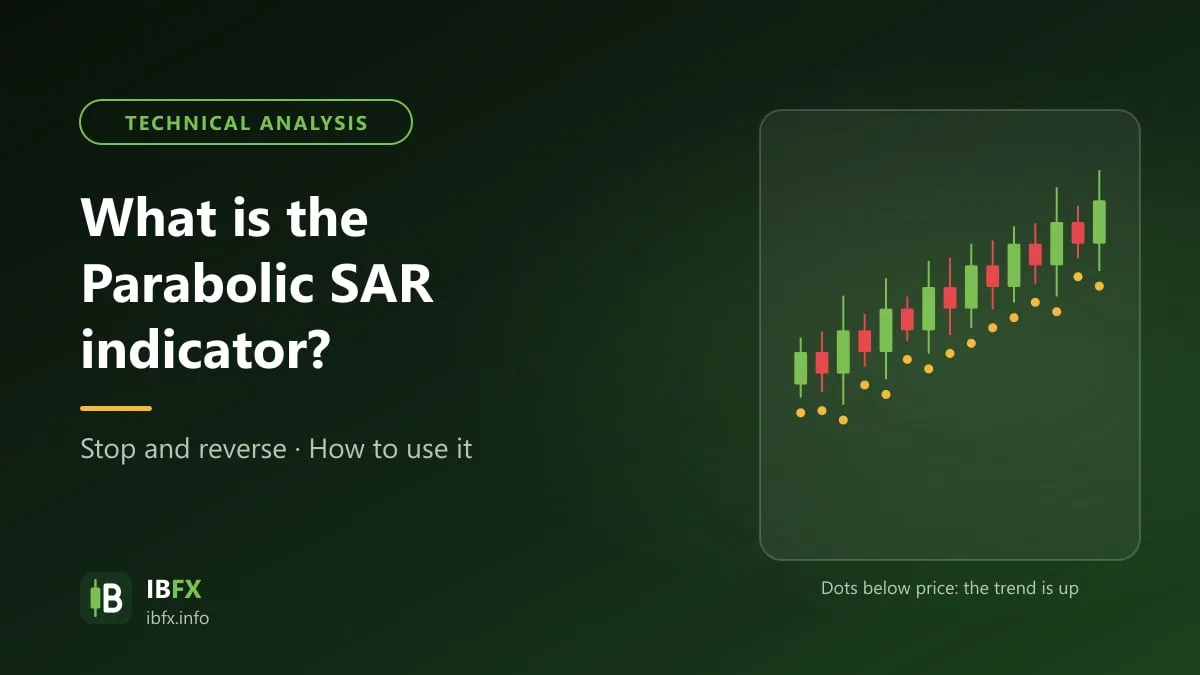
On the chart, PSAR is drawn as round dots, or points, following one after another to form parabolic curves. Each dot is one value of the indicator for one trading session, and it may sit above or below the candle.
The value of the indicator, that is of each dot, is worked out with the following formula:
PSAR (n) = PSAR (n-1) + AF * [ EP – PSAR (n-1) ]
This formula carries one clamping rule that Wilder set alongside it and that usually gets dropped when the formula is quoted: the SAR value for the next period may not sit inside the price range of the current period or of the one before it. If the sum produces a value that falls inside that range, it has to be pushed out to the nearest extreme of those two periods. Without this rule, a PSAR series you build yourself will drift away from the one your platform draws.
In which:
- PSAR (n) is the value of the indicator for the current trading session
- PSAR (n-1) is the value of the indicator for the trading session immediately before it
- AF (Acceleration Factor). When a new PSAR trend begins, AF is 0.02; each time price makes a new extreme (a higher high in an uptrend, or a lower low in a downtrend), AF rises by a further 0.02, up to a default maximum of 0.2. When PSAR reverses, AF goes back to 0.02. That is why the longer a trend runs, the faster the PSAR dots close in on price. You can adjust this factor to suit the time frame and the strategy, but the higher AF is, the more sensitive PSAR is to price and the more reversal signals appear as noise; the lower AF is, the slower PSAR is.
- EP (Extreme Point): the extreme price points. EP is the highest price in an uptrend, or the lowest price in a downtrend.
How to set the Parabolic SAR indicator up on MT4
Nearly every piece of forex trading software has the PSAR indicator built in, so you do not have to go looking for a download and install it into the software yourself.
In the MT4 software, to open the PSAR indicator you follow this path: Insert → Indicators → Trend → Parabolic SAR.
The settings box opens as below:
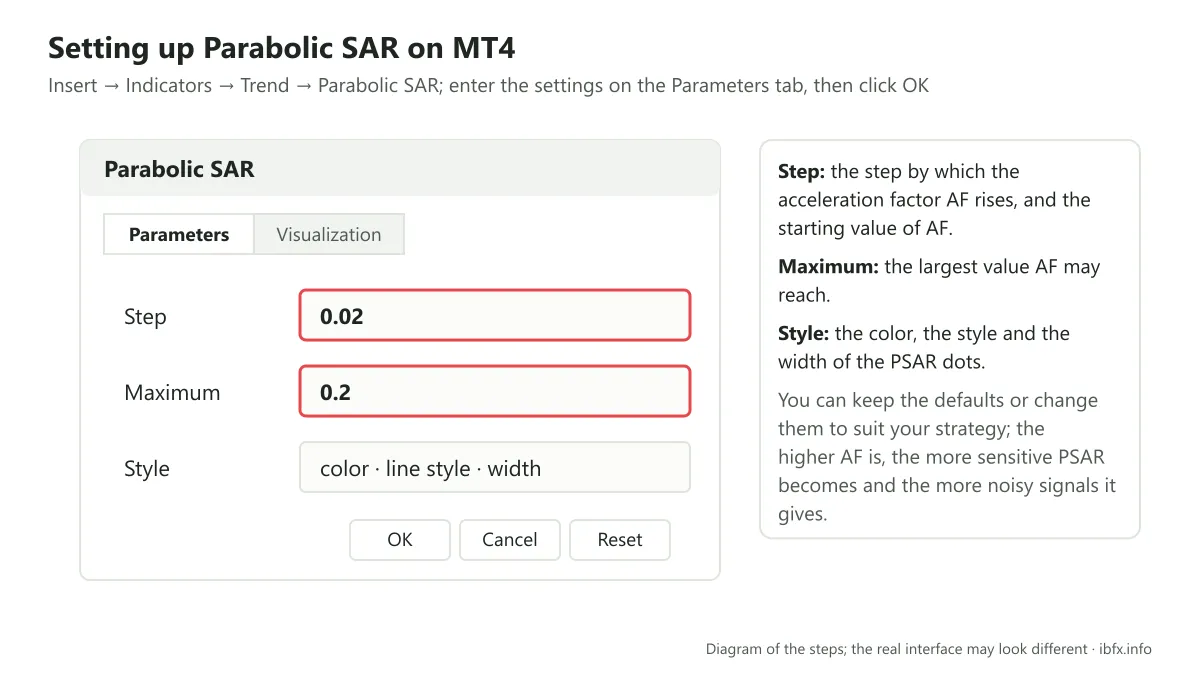
On the Parameters tab you set the values of the indicator, which are:
- Step: this is the step by which the acceleration factor rises or falls, and also the first value of the acceleration factor (AF) in the formula above.
- Maximum: the largest value of the acceleration factor
You can keep these default values or change them depending on the particular strategy.
Next you set the color and the width of the indicator.
The Visualization tab is where you pick the time frames you want the indicator inserted on.
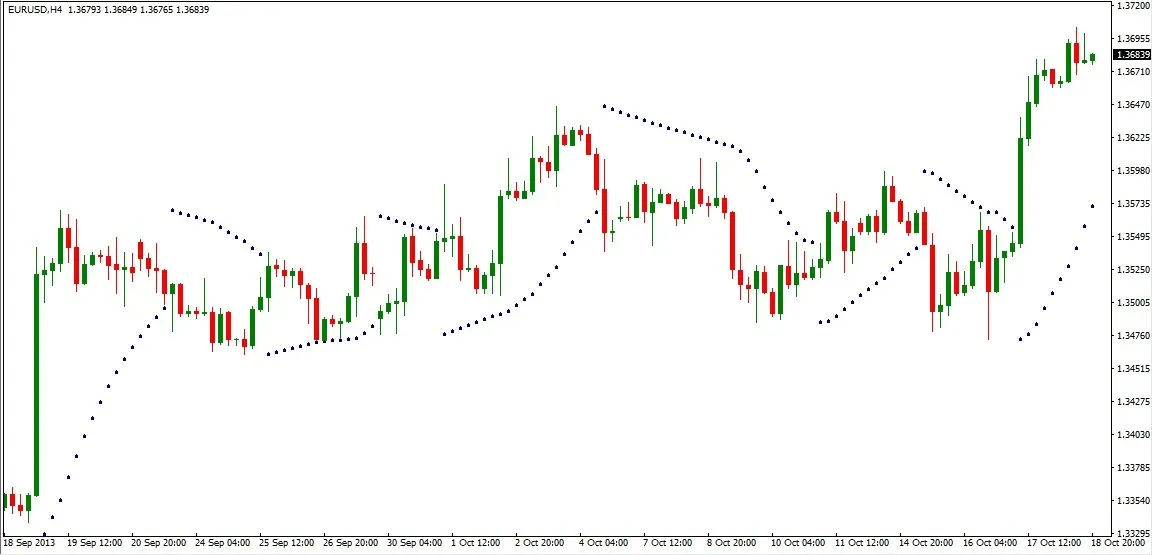
Once you have finished, click OK and the indicator appears on the price chart as in the picture below:
How to trade well with the Parabolic SAR indicator
In this part we introduce the ways of using the PSAR indicator through its 3 main jobs, and the strategies that combine PSAR with other technical analysis tools.
The 3 jobs of the PSAR indicator
PSAR identifies the trend of the market
- PSAR below the price line → the market is in an uptrend
- PSAR above the price line → the market is in a downtrend
A widening gap between PSAR and price usually shows that price is moving hard with the trend; when the PSAR dots keep flipping from one side to the other, the market is moving sideways.
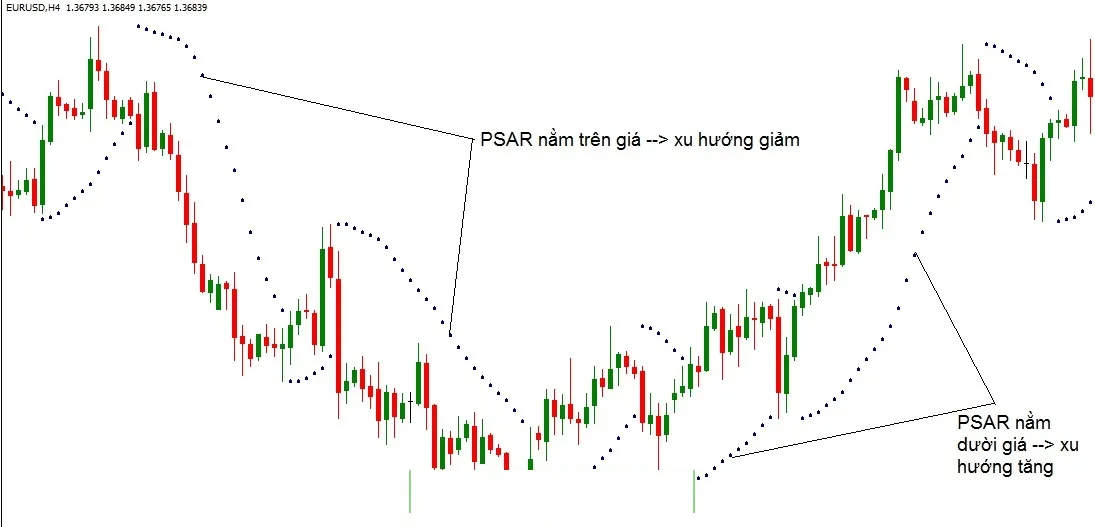
The screenshot shows the Vietnamese-language interface; the buttons and labels sit in the same places in the English one.
PSAR marks the entry point
In practice the way you enter using PSAR differs from strategy to strategy, which we set out more clearly below. In the basic form, though, entering on the PSAR indicator works like this:
- Enter a Buy when PSAR moves from above the price line to below the price line
- Enter a Sell when PSAR moves from below the price line to above the price line.
PSAR marks the exit point
This job is the opposite of marking the entry:
- If you are holding a Buy → close the trade when PSAR starts moving above the price line, that is, when the dot suddenly jumps from below price to above price.
- If you are holding a Sell → close the trade when PSAR starts moving below the price line, that is, when the dot suddenly jumps from above price to below price.
Strategies that work with PSAR
Trading with the trend
This is the strategy we would suggest for newer traders, because it is fairly easy to use and carries less risk. Of all the strategies that use indicators, this is the one we always rate highest.
First, have a look at the picture below:
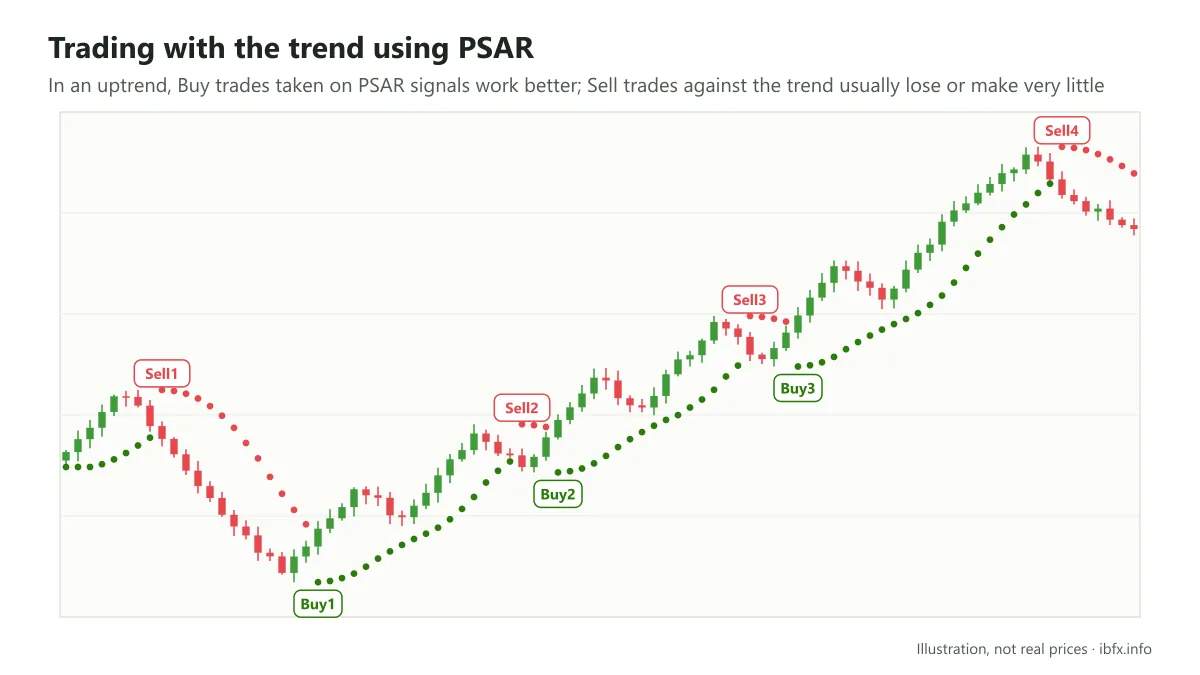
In the picture above it is clear that out of all the trades, only Sell1 and the Buy trades worked; the other Sell trades either lost or made a profit so small it did not cover the costs. The reason the Sell trades did not work is that the market was in an uptrend, and the Sell signals were only the market pulling back inside that uptrend. Sell1 made a profit because the market was still in a downtrend at that point, and it was only from Buy1 onward that it turned properly into an uptrend. That is why, if you want to trade on the entry signals from the PSAR indicator, you should trade with the trend to hold down the risk from false signals.
The way to trade it is as follows:
- Identify the overall trend of the market
- If the market is rising: only wait for PSAR to appear below the price line and enter a Buy
- If the market is falling: only wait for PSAR to appear above the price line and enter a Sell
- Place the stop loss at the nearest high before it (a downtrend, a Sell) or the nearest low before it (an uptrend, a Buy)
- Combine the PSAR exit signal with other reversal signals to close the trade.
In this strategy an experienced trader can add another trade while the market is in a strong trend, but only once the previous trade has had its stop loss moved to break even and the total risk of all the trades is still inside the allowed limit; you can use a trailing stop (moving the stop loss along the PSAR dots) to protect the profit. A newer trader should take one trade at a time.
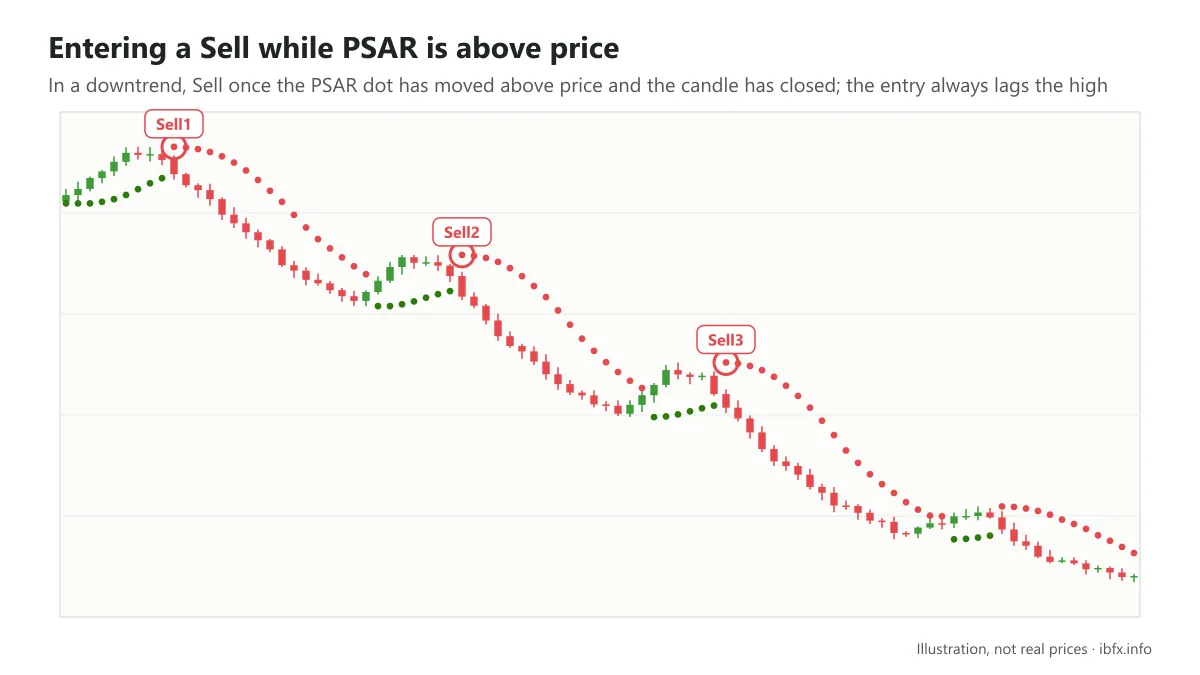
The PSAR dots keep jumping up and down as price moves during the session, so the dot only settles into its final position once the candle has closed. For that reason you have to wait for the candle to close before you enter.
In all 3 of the Sell trades above, none of the 3 entries is the best possible entry, because the Parabolic SAR is by its nature a lagging indicator with a lot of delay, and the signals it produces usually come late compared with the move in price.
Trading a trend reversal
Trading reversals is a much harder strategy than trading with the trend, because indicators usually give noisy reversal signals, and without much experience or without other tools alongside it is very easy to get it wrong.
Going back to what PSAR says about the trend: if PSAR is above the price line the market is in a downtrend, and the other way round. But if you see a single PSAR dot above price and rush to conclude that a downtrend has started, or a single PSAR dot below price and conclude that an uptrend has started, you will become the “prey” straight away.
Working out whether a new trend has formed with the Parabolic SAR involves a rule known as the 3-point or 3-dot rule. It can be stated like this:
- The market turns up when PSAR cuts the price line from above and forms at least 3 rising PSAR points (dots) below the price line.
- The market turns down when PSAR cuts the price line from below and forms at least 3 falling PSAR points (dots) above the price line.
The way to trade a reversal is as follows:
- Enter a Buy after PSAR has formed 3 rising points below price. Enter as the third point finishes.
- Enter a Sell after PSAR has formed 3 falling points above price. Enter as the third point finishes.
- Stop loss at the low of the downtrend (a Buy) or the high of the uptrend (a Sell).
- Use this same reversal signal to close the trade, or close once you have reached the Risk:Reward ratio you wanted.
With this strategy you can also add further trades after the first one has worked, the trend of the market has firmed up and price is rising or falling hard. At that point you simply go back to the with-the-trend strategy above.
For example:
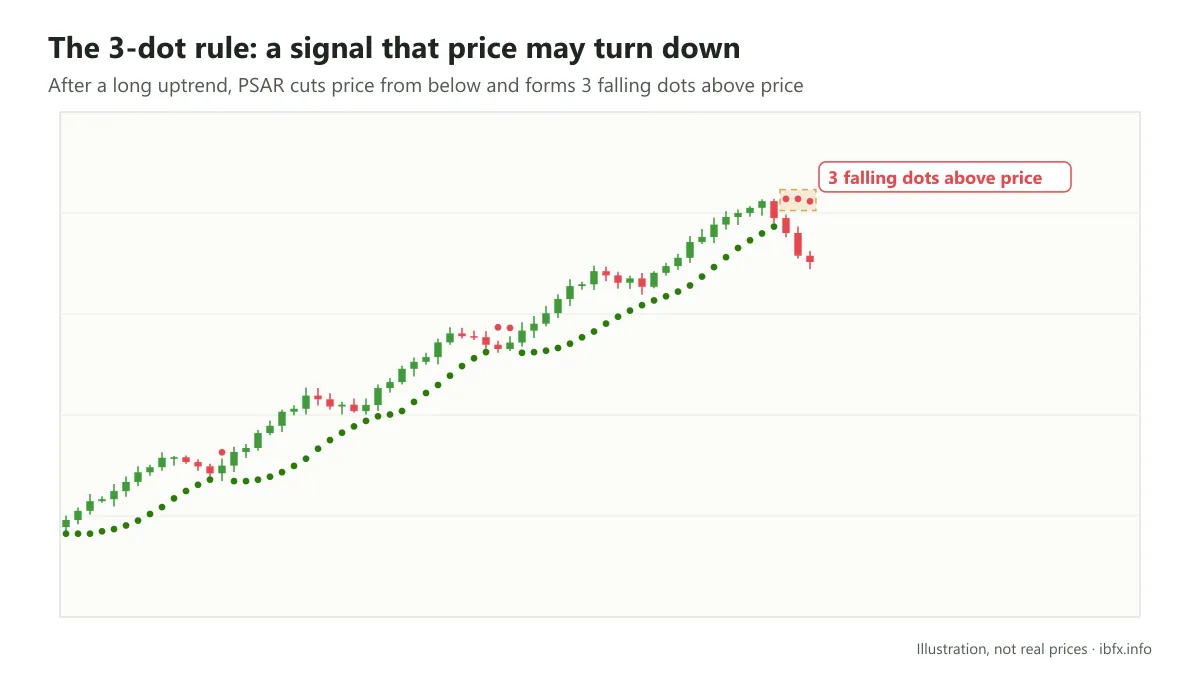
After a long uptrend before it, price starts to put in deeper falls, and at the same time PSAR forms 3 falling points right above the price line; this may be a sign that price really will turn.
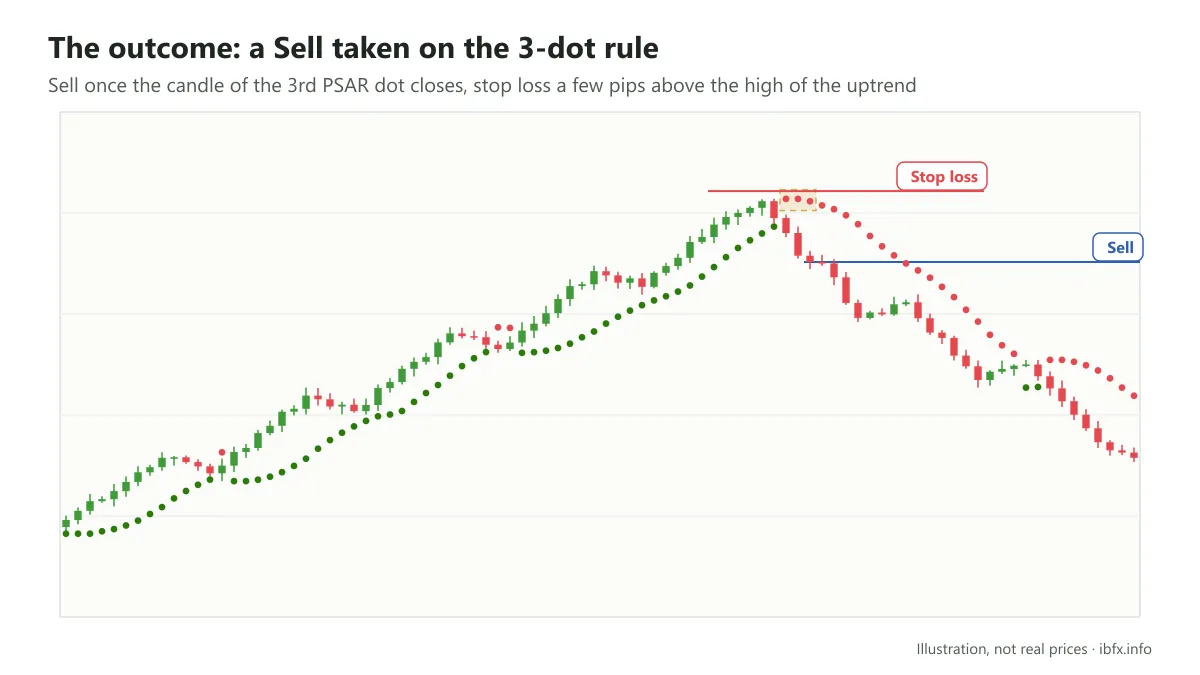
- Enter a Sell as soon as the candle matching the 3rd PSAR point closes.
- Stop loss a few pips above the high of the uptrend.
And the outcome was…
For example:
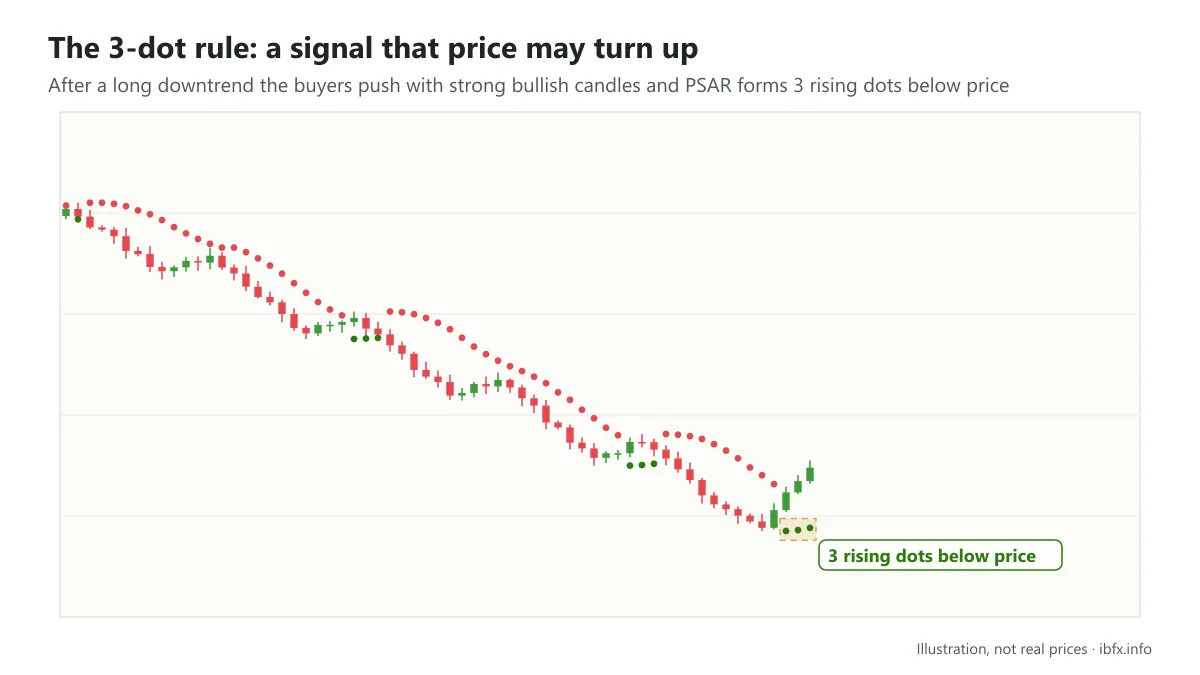
Much like the situation above, the downtrend had run for quite a while and looked as though it had put in a low, with the buyers attacking again and again with strong bullish candles. At that point PSAR had also formed 3 rising points below the price line, and this may turn into a strong uptrend.
- Enter as the candle matching the 3rd PSAR point closes
- Stop loss about a few pips from the low of the downtrend
Let us look at the outcome
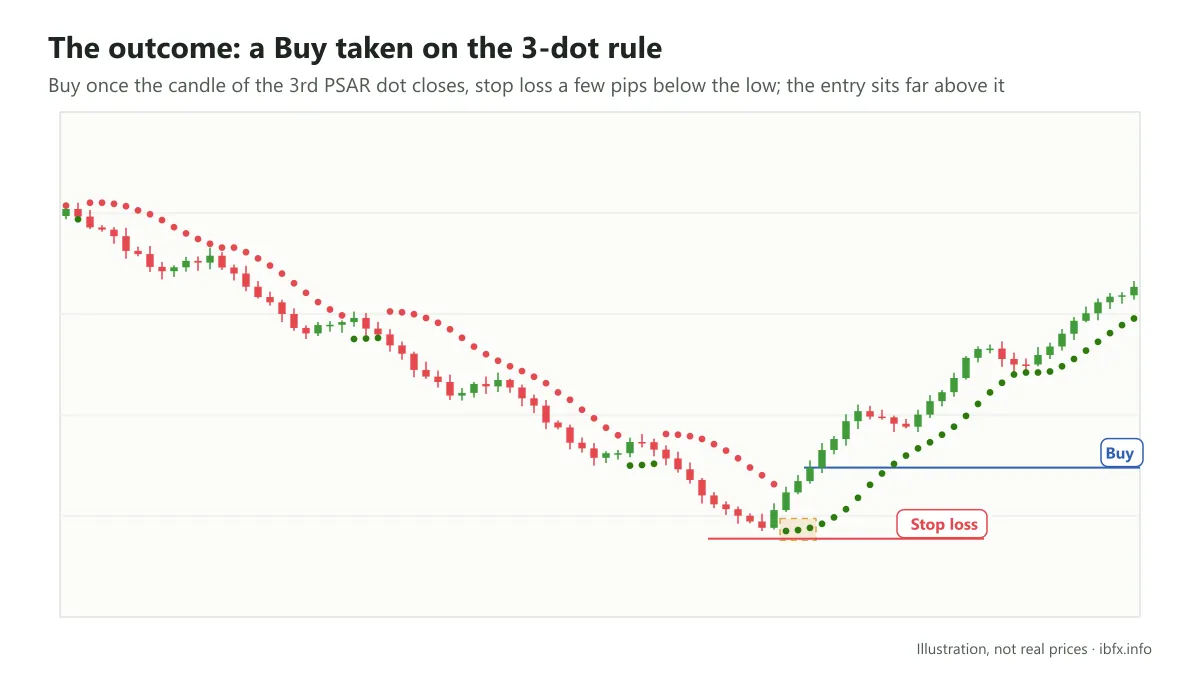
Note that the examples above were picked once the outcome was already known; in real life the 3-dot rule can still give a false signal. Both of these situations share one thing, and it is also the weak spot of the PSAR indicator. The entry in both cases is not a good one: the entries sit quite a long way from the high or the low, which cuts the profit down a great deal, especially in the second situation.
It is for this reason that traders rarely use the 3-dot rule; they usually combine PSAR with other tools to find a better entry.
Combining the Parabolic SAR with other technical analysis tools
Parabolic SAR with important price zones
The important price zones in forex trading are the strong support and resistance levels, the places where price usually reacts. Traders combine the 2 tools to find the moment price may turn and enter there.
- If PSAR gives a Buy signal (a PSAR dot appears below the price line) and price is at a strong support zone, that is a good Buy signal; the other way round, if price is at a resistance zone then the Buy signal PSAR gave may be noise.
- If PSAR gives a Sell signal (a PSAR dot appears above the price line) and price is at a strong resistance zone, that is a good Sell signal; the other way round, if price is at a strong support zone, that PSAR signal is likely to be noise.
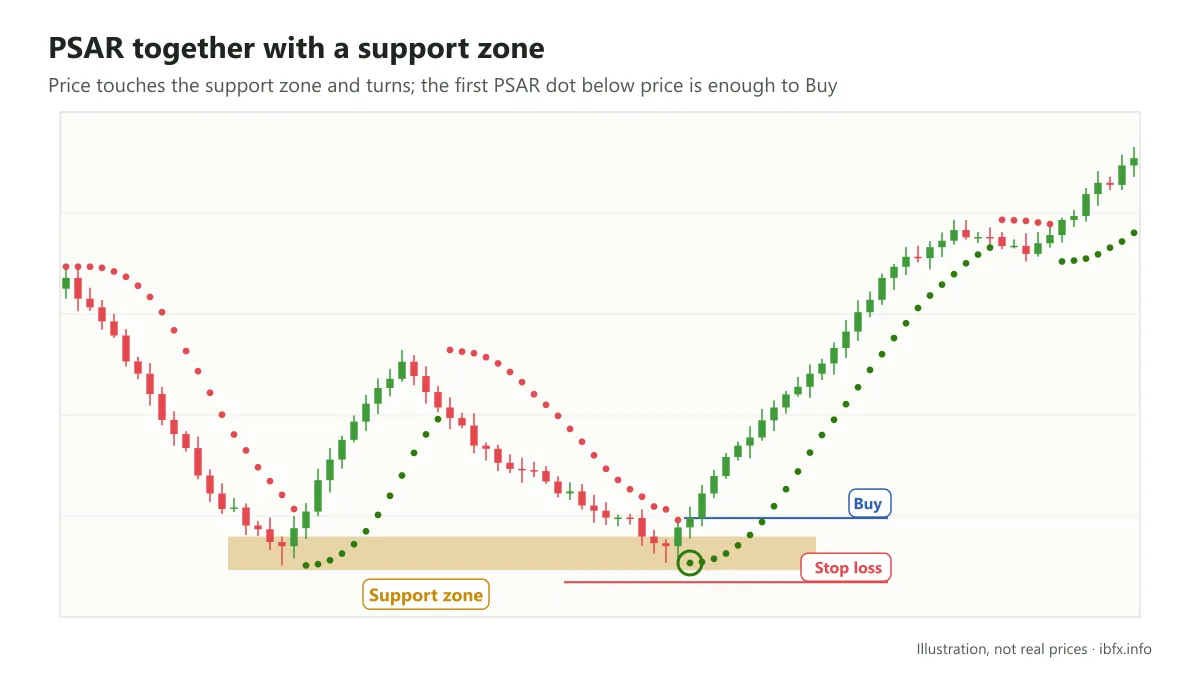
For example:
Once you have identified the important support zone, when price touches that zone and turns, all you need is one PSAR point appearing below the price line and you can enter a Buy. The 3-dot rule does not have to be applied in this strategy, because the Buy signal has already been confirmed by the support zone, and the profit will be larger than it would be using the 3-dot rule.
For example:
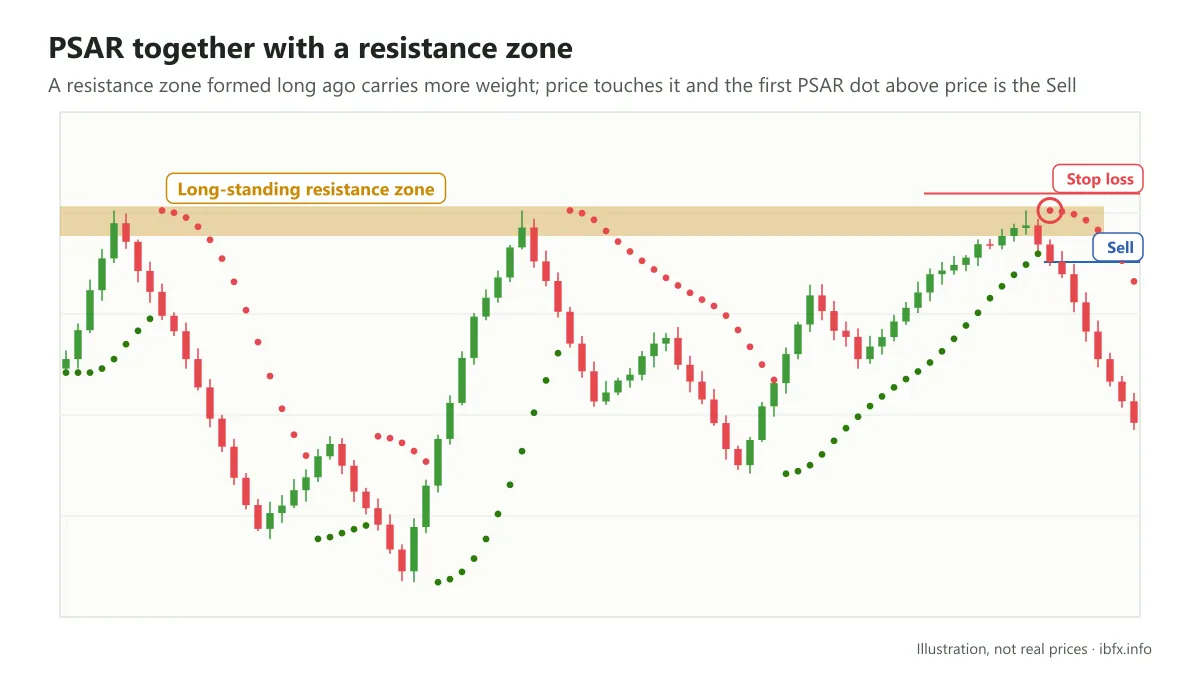
Important price zones are usually marked out over a stretch of time close to now, in the short term (as in the situation above); traders often pay no attention to the important price zones in the long term, yet those are very strong barriers where price tends to react.
What you need to do is zoom the chart out to find these important resistance and support levels. Clearly, the resistance zone in this case is an extremely important price zone with strong resistance, the price zone that formed the high of the strong uptrends before it.
When price touches this level again and turns, you wait for PSAR and a single point above the price line is enough to enter a Sell straight away.
In this strategy you can perfectly well use the PSAR exit signal to close the trade, or a signal from any other tool, or simply close once the profit has reached the level you expected.
Parabolic SAR with the trendline
The trend line (trendline) can be combined with PSAR in a with-the-trend strategy.
In the with-the-trend strategy, for an uptrend you enter a Buy when PSAR appears below price, but this Buy signal is stronger if the price levels there touch the rising trendline of the trend.
The other way round, for a downtrend, a Sell signal taken when PSAR appears above price has a better chance of working if the price zone there touches the falling trendline of the trend.
For example:
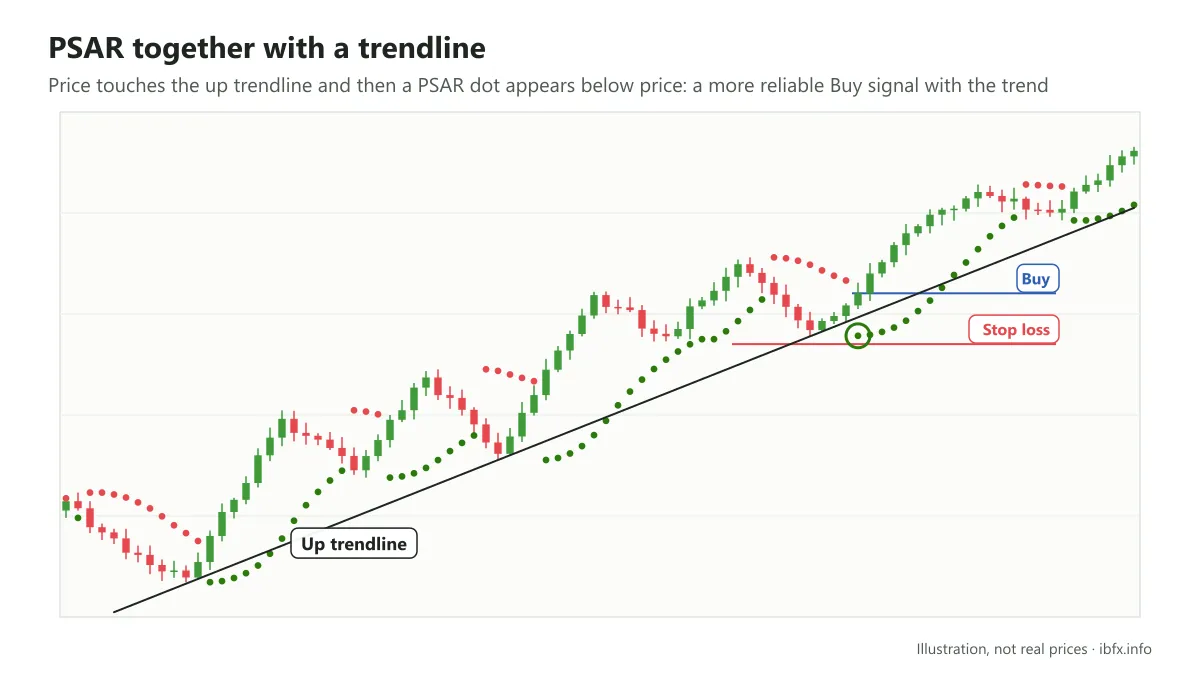
When price makes a low above the one before it, you draw the trendline for the uptrend. When price touches the trendline we can expect it to rise again, but to be surer of it, wait for PSAR to appear below the price line. The combination of these 2 signals gives a Buy that works better.
As soon as PSAR appears below price, enter a Buy when the candle matching that PSAR point closes. Place the stop loss a distance from the nearest low before it. Use the PSAR exit signal, or combine it with other reversal signals, to close the trade.
Parabolic SAR with the price action method
Price action is nothing new to technical traders; it is the school that reads the action of price and the mood of the market straight off the chart. Almost every indicator can be combined with the signals of this method.
And one of the most widely used price action tools we want to talk about in this combination is the reversal candlestick patterns.
If you do not know them yet, you can read the article: The important reversal candlestick patterns you need to know in forex.
This combination is used in the reversal strategy with PSAR.
Here too, though, we still will not use the 3-dot rule, because the 3-dot rule is for when you use PSAR as a stand-alone strategy. Once you have combined PSAR with some tool or method that confirms the reversal signal, you only need the 1-dot rule.
- When an uptrend has run for a while, if PSAR appears above the price line and price forms a bearish reversal candlestick pattern there, the signal that price may turn down is reinforced.
- When a downtrend has run for a while, if PSAR appears below the price line and price forms a bullish reversal candlestick pattern there at the same time, the signal that price may turn up is reinforced.
For example:
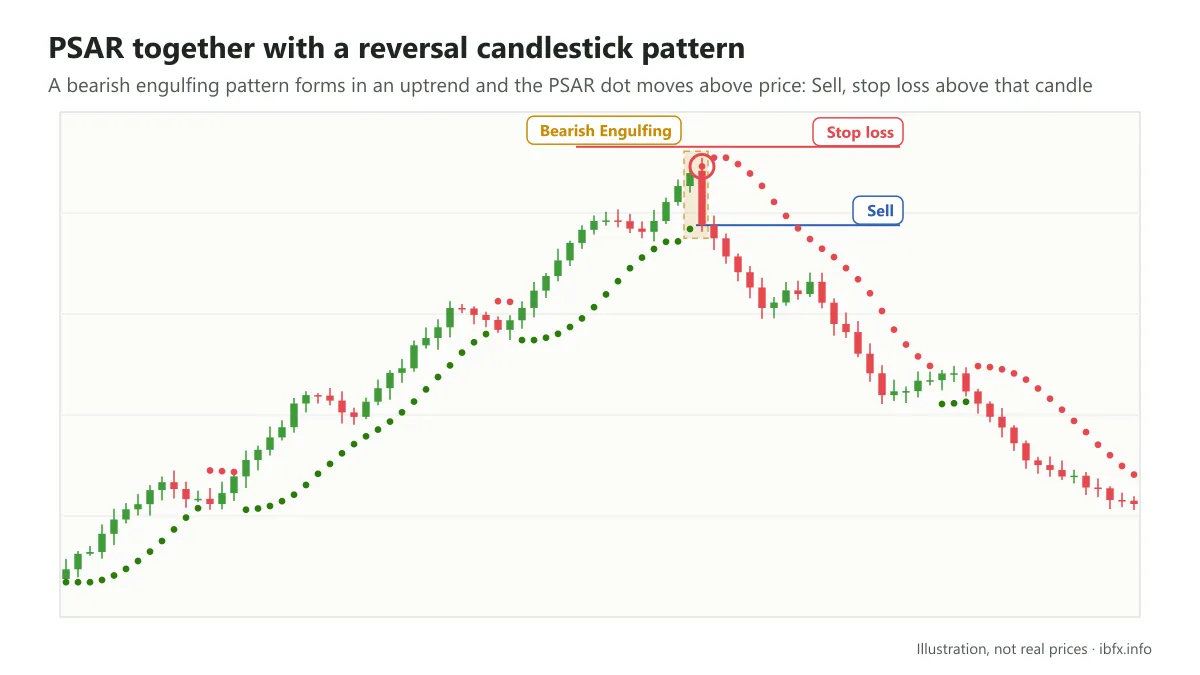
While the market was still in an uptrend, the Bearish Engulfing candlestick pattern appeared; this is a bearish reversal pattern that many traders watch, and it suggests the market may turn down. At the same time, one trading session after the Bearish Engulfing pattern, PSAR appeared above the price line, which makes the bearish reversal signal more reliable still.
Enter a Sell when the candle matching that first PSAR point closes, with the stop loss above the highest price of the bearish candle in the Bearish Engulfing pattern.
For example:
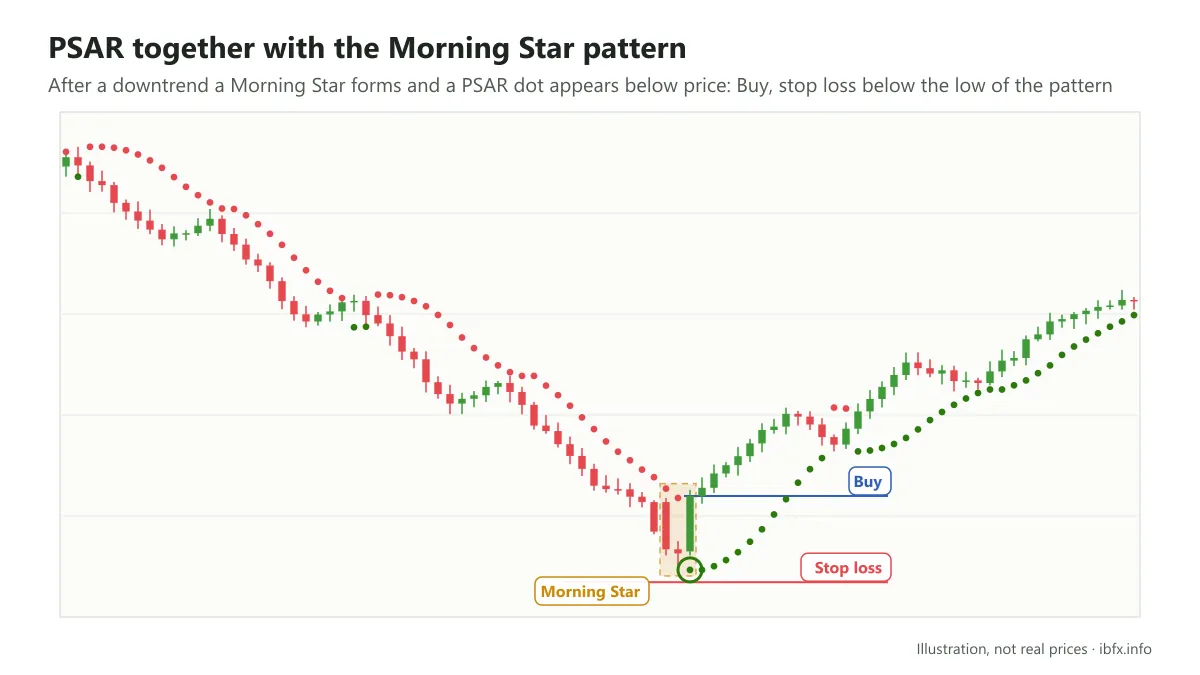
And this is the combination of a bullish reversal signal from PSAR and the bullish reversal candlestick pattern the Morning Star.
Besides combining PSAR with other tools one at a time to confirm a signal, you can still use several confirming tools at once. Pick tools that measure different things, though (a price zone, a candlestick pattern, the trend); using several indicators of the same kind only repeats the same signal rather than making it stronger.
We hope that through this article you understand the Parabolic SAR indicator better, what it means and how to use it. Getting good at an indicator is not easy and asks a trader to practice a great deal on a demo account. PSAR is not a holy grail: no indicator is right every time, so always place a stop loss and manage your money carefully.