On this page
If you trade over the medium and long term you will regularly look at charts on the higher timeframes such as daily, weekly and monthly. Among those, the open price of the week, the month and the year are reference levels that a good many traders watch. So what do these open prices mean, and how do you use them?
Trading from the open price takes much the same approach as trading around pivot points: you mark a number of important price levels in advance and watch how price reacts when it comes back to them. This way of working leans towards waiting, so it may not suit traders who want to be in the market every single day.
What do these open prices tell you?
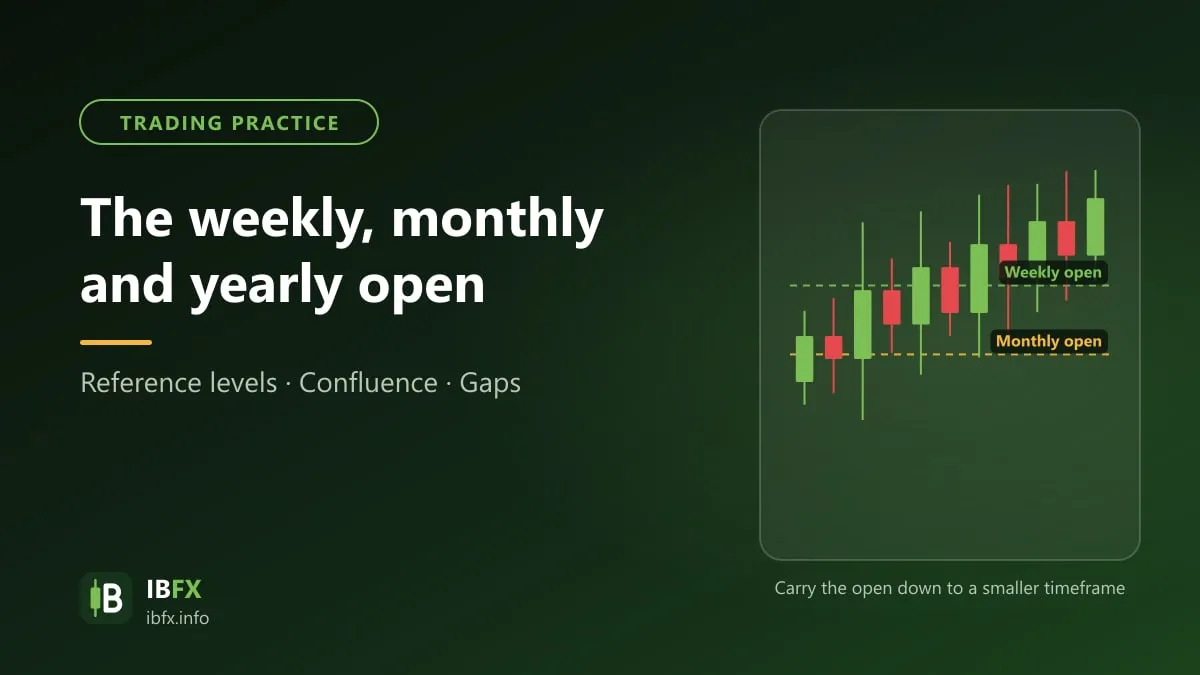
The weekly open is the first price of the weekly candle, and the same goes for the monthly and the yearly open. When you extend these levels to the right and look at them on the smaller timeframes (H4, H1), you gain a few reference lines much like support and resistance levels:
- Price sitting above the weekly open means the weekly candle is currently a bullish candle and buyers have the upper hand for the week; price below it means sellers have the upper hand. The same applies to the month and the year.
- Many funds and institutions measure their investment performance by month, quarter and year, so the price at the start of the period is the mark they compare their profit and loss against. That is one reason these levels get attention.
- When price comes back near the open, the market often reacts in some way (bouncing off it or breaking through), which gives traders one more reference point for planning.
Note that the opening time of the day, the week and the month depends on the server timezone of each broker (many use GMT+2 or GMT+3), so the open price can differ slightly from one broker or platform to another. This is why you should treat these levels as a price area rather than an exact number.
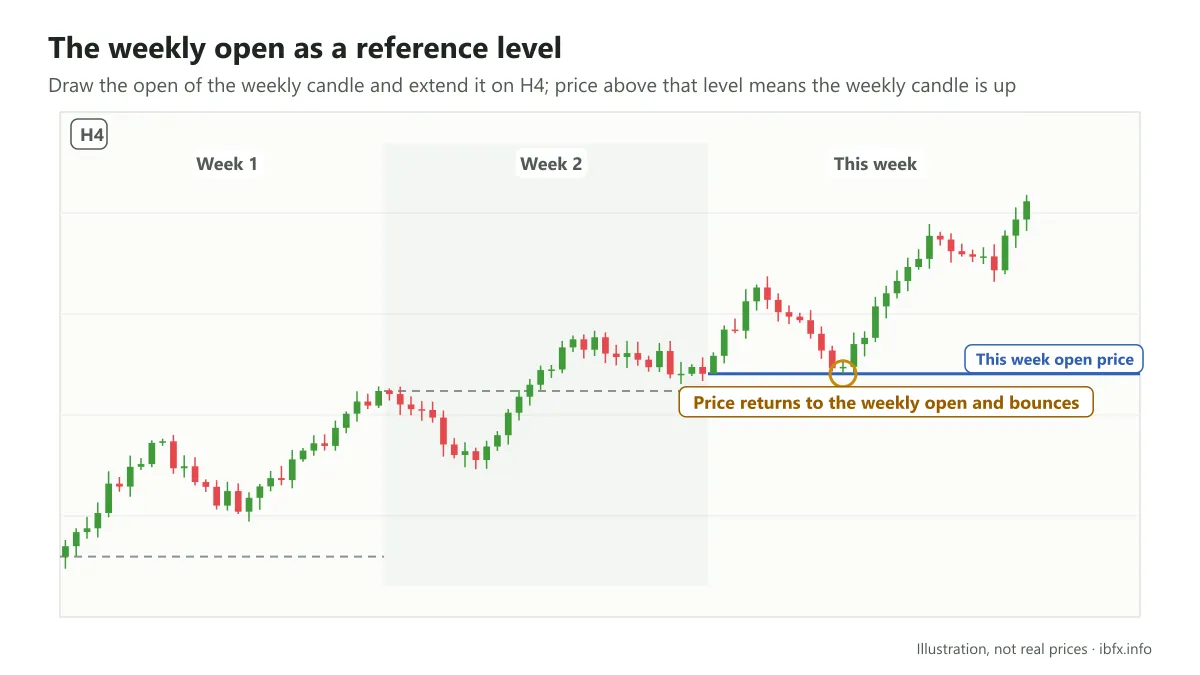
The weekly open extended onto a smaller timeframe as a reference level.
How to draw the open price on your chart
- Open the weekly chart (or the monthly, or the yearly) and find the open price of the current candle. Take the open price only, not the high, the low or the close.
- Draw a horizontal line at that price and extend it to the right.
- Switch back to the timeframe you trade on (H1 or H4, for example) and watch how price reacts as it approaches this line.
- When a new week, month or year begins, draw the new open level; the old levels can still be kept for reference if they are near the current price.
On TradingView there are many community-written indicators that draw the weekly, monthly and yearly open automatically, which saves you time. See also: What is TradingView?
Why does price often react at the open level?
There is no explanation that has been proved beyond doubt, but a few theories come up often:
- A lot of people are watching it: when enough traders place orders, stop losses and take profits around one price level, a reaction at that level becomes more likely.
- The way large institutions enter: an individual trader entering a few lots is usually filled straight away, but institutions trading very large size cannot get it all done at once without pushing price a long way. They usually break the order up and enter gradually around the price areas they want; some people think the part of the order still unfilled around important price levels is what makes price react when it returns. This is a theory, not a rule.
- End-of-period rebalancing: at the end of a week, a month, a quarter or a year, many funds close or open positions or rebalance their portfolios, which brings volatility around the turn of the period.
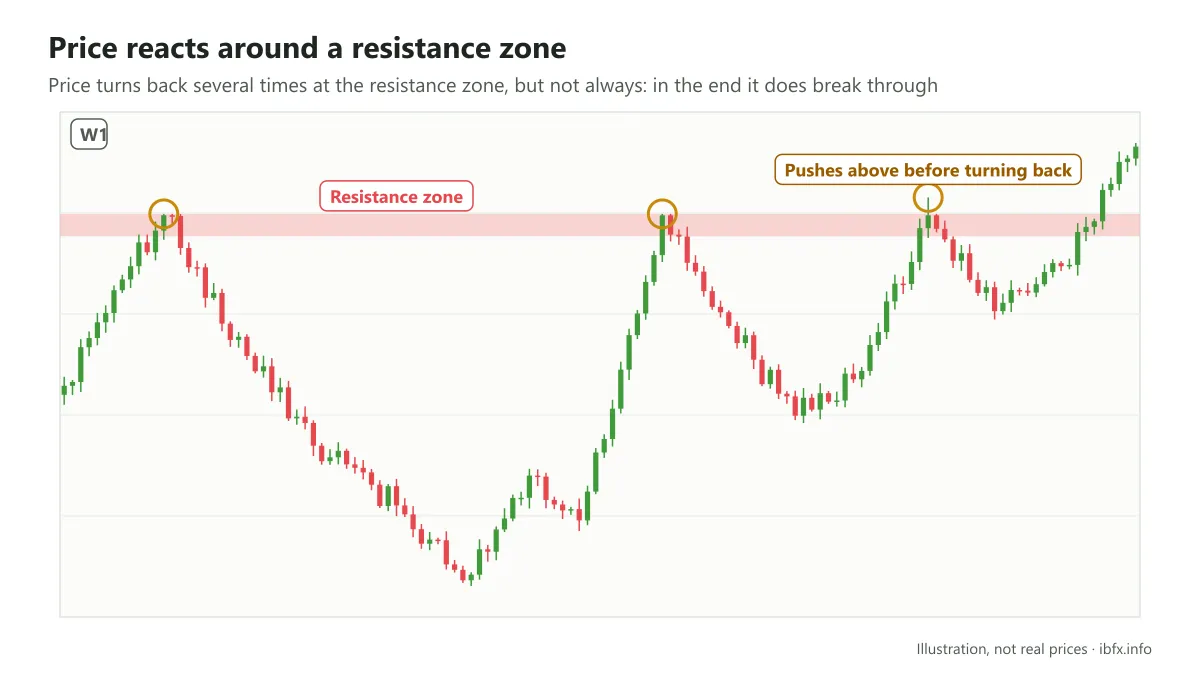
Price often reacts around important price levels, but not every time.
The weekly open is a special case: because the market is closed over the weekend, the open price on Monday morning can differ from the Friday close, leaving a gap. Price often comes back to fill the gap, but not every time. See also: What is a gap?
How to use the open price well
For an individual trader, the weekly, monthly and yearly open should only be used as a reference area; you should not take a trade merely because price has touched the line. What matters is finding confluence: an area where the open price lines up with other factors such as old support and resistance, a Fibonacci level, a pivot point or a trendline. The more factors that line up, the more the area is worth watching, and you should still wait for a confirming candle before you enter.
For example: price is in an uptrend and pulls back exactly to the monthly open, which also lines up with an old resistance area that has been broken (and has now become support). If a candle appears rejecting lower prices, you might consider a buy, with the stop loss below that area.
Draw these levels as price areas, trade at a moderate position size (risking about 1–2% of the account per trade), always place a stop loss, and do not stack up more trades when price breaks through the area. Protecting your capital comes first.