On this page
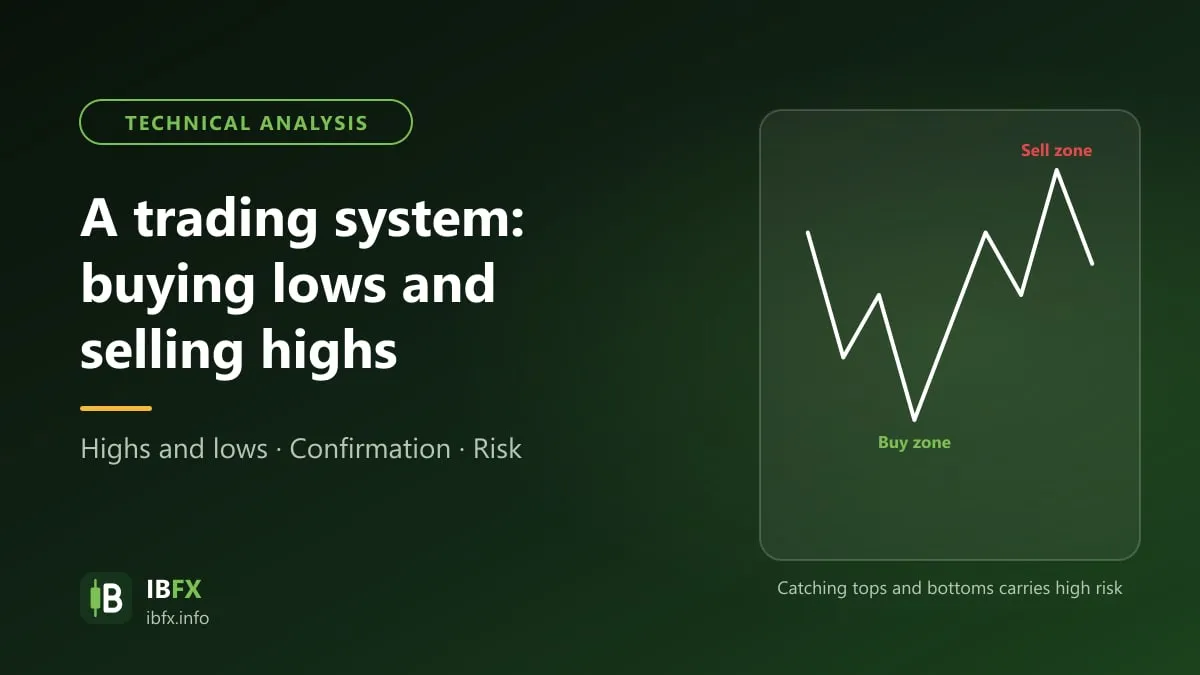
In financial trading in general, and in forex trading in particular, marking out the potential high and low areas so that you can plan a trade is an important skill.
Let us look at how you trade at these high and low areas. Note that nobody buys the exact low and sells the exact high on any regular basis; the aim is to enter at price areas where you have an edge, with a clear stop loss.
- What is forex?
- What is forex trading? A guide for beginners
- How to check a forex broker before you open an account
What are highs and lows?
The place where price reverses is called a reversal area.
If it is a reversal area where price turns from rising to falling, we call it a high.
The other way round, if it is a reversal area where price turns from falling to rising, we call it a low.
It really is that simple. The chart below is an example of highs and lows:
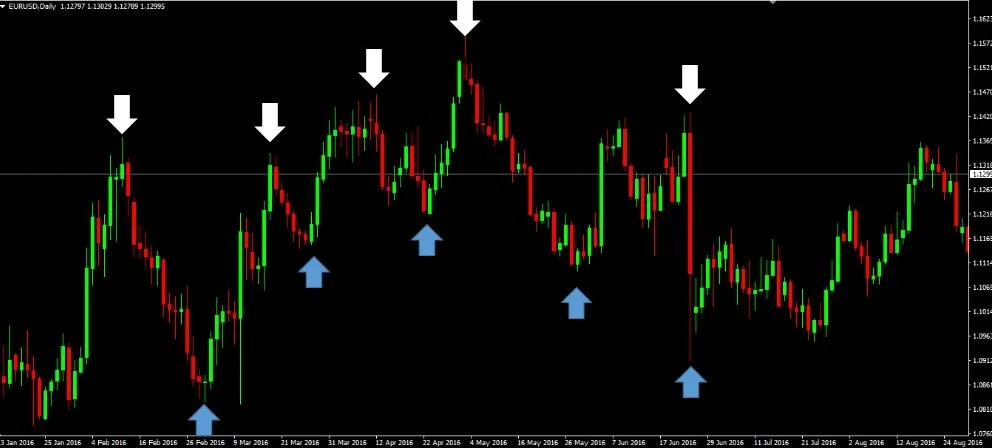
How to identify highs and lows in forex
So now we are clear on what highs and lows mean in forex. But how do we work out when one of those highs or lows is forming?
That is the whole question, and it decides how well our trading system performs.
There are many ways to identify the high and the low of an instrument, but below I will take you through the 2 ways that are as easy to understand and as easy to carry out as possible.
Method 1: Identify highs and lows from the old highs and lows that have already formed.
This one is fairly simple: it rests on the idea that history can repeat itself, meaning a later high or low can form on the basis of an old high or low that was created before it.
For example, if a high has formed before, then when price comes back to that area there is a chance that price meets selling pressure and forms a new high (this is a resistance area), although price can also break through and carry on up.
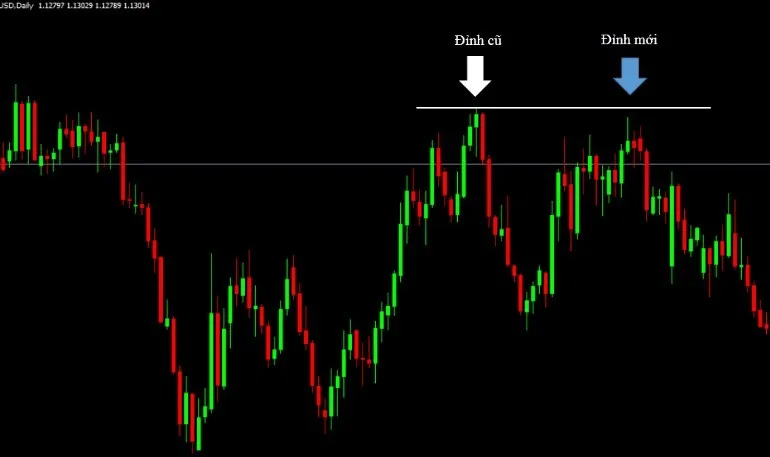
The screenshot shows the Vietnamese interface; the buttons and labels sit in the same places in the English version.
The other way round, if a low has formed before, then when price comes back to that area there is a chance that price meets buying pressure and forms a new low (a support area), although price can also break through and carry on down.
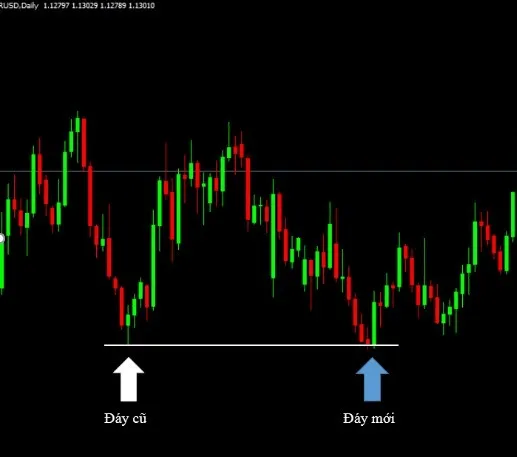
The screenshot shows the Vietnamese interface; the buttons and labels sit in the same places in the English version.
Method 2: Identify highs and lows with Fibonacci
This one is also fairly simple and easy to carry out, and it applies in a market that is trending.
We use the Fibonacci Retracement tool to find the price area where the pullback may end.
Here is how to do it:
For an uptrend
Step 1: Find the old low of the trend
Step 2: Find the old high of the trend
Step 3: Bring up the Fibonacci tool in MT4
Step 4: Drag the Fibonacci from the old low to the old high of that uptrend
Step 5: The 50–61.8 area of the Fibonacci is the area people usually watch, where the new low may form (price can also pull back less deeply or more deeply)
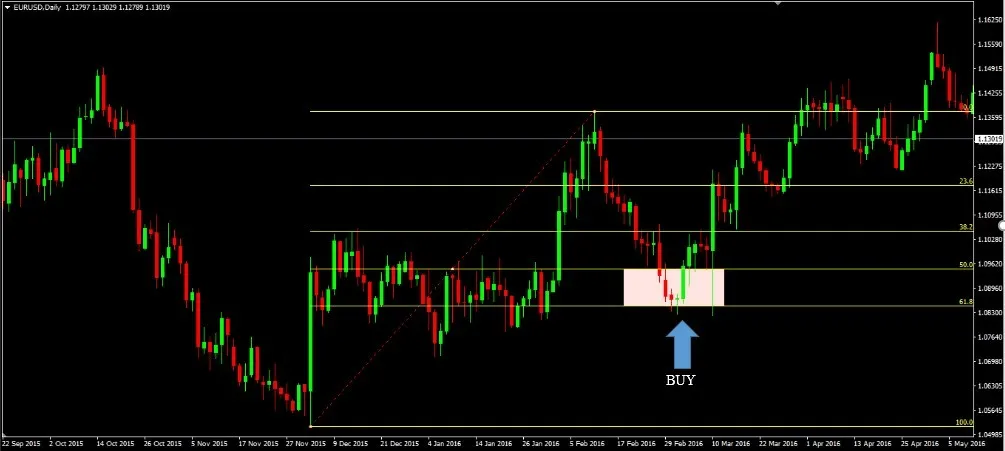
Finding the new LOW area to wait for a BUY with Fibonacci
For a downtrend
Step 1: Find the old high of the trend
Step 2: Find the old low of the trend
Step 3: Bring up the Fibonacci tool in MT4
Step 4: Drag the Fibonacci from the old high to the old low of that downtrend
Step 5: The 50–61.8 area of the Fibonacci is the area people usually watch, where the new high may form
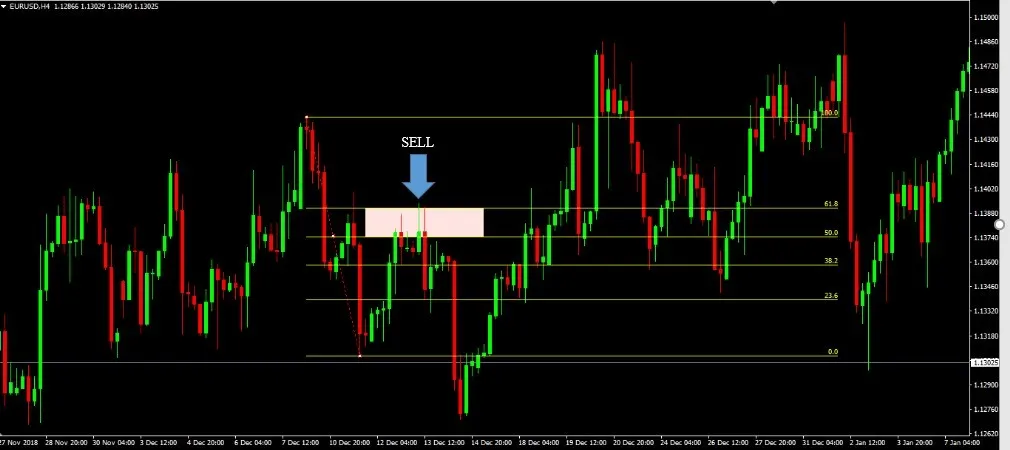
Finding the new HIGH area to wait for a SELL with Fibonacci
By now you should have a picture of how to find the potential high and low areas. Let us finish the system off by setting up the trade itself.
Trading the buy-the-low, sell-the-high system
With the 2 ways of identifying highs and lows above, I will take only one example of setting up a trade, a BUY; for setting up a SELL you do the opposite.
Three important rules before you enter:
- Favor buying at a low area when the higher-timeframe trend is up or moving sideways; buying at an old low while the market is falling hard is catching a falling knife, and is very risky.
- Do not enter merely because price has touched the area; wait for a confirming signal such as a reversal candle (a Pin Bar, an engulfing candle and so on).
- Work out the position size from the stop loss distance so that each trade risks only a small part of the account (1–2%, for example).
With method 1: trading the low and the high from the old low and old high.
In the example below we look at EURUSD on the Daily timeframe.
Step 1: Find the old low before it
Step 2: Draw a horizontal support line across that low
Step 3: When price comes back to this support area, wait for a confirming signal (a bullish reversal candle, for example) and then enter
Step 4: Set the Stop Loss below that low, far enough to avoid the noise; the distance depends on the timeframe and the volatility (on D1 it is usually a few dozen pips or more, and you can use the ATR indicator as a guide)
Step 5: Set the Take Profit at about 2–3 times the Stop Loss, or at the nearest resistance area (each trader sees this differently)
And that is a BUY trade set up at the Low; selling at the High works the same way.
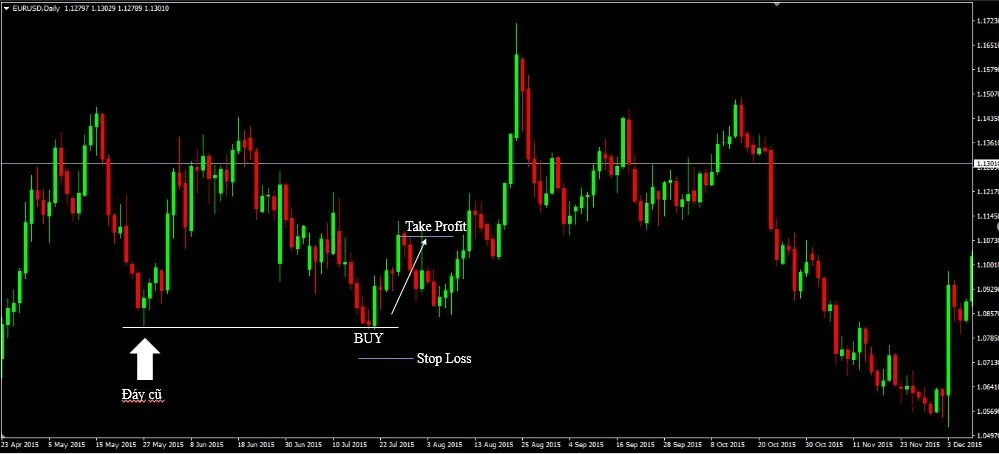
The screenshot shows the Vietnamese interface; the buttons and labels sit in the same places in the English version.
With method 2: trading the low and the high with Fibonacci
Again, in the example below we look at EURUSD on the Daily timeframe.
How to trade it with Fibonacci (this only applies when the market is in a clear uptrend):
Step 1: Find the old low before it
Step 2: Find the old high before it
Step 3: Drag the Fibonacci from the old low to the old high
Step 4: Wait for price to pull back into the 50–61.8 area of the Fibonacci and give a confirming signal, then enter the BUY
Step 5: Set the Stop Loss below the 61.8 area (many traders put it below the 78.6 level, or below the old low, to be safer); the distance depends on the timeframe
Step 6: Set the Take Profit at about 2–3 times the Stop Loss, or at a nearer Fibonacci level if there is clear resistance there. In the two pictures below, the Take Profit arrow stops around the 23.6 level rather than running all the way back to the 0 level (the old high), so the run is shorter than 2–3 times the Stop Loss — this is the choice you have to make: take the nearer level for certainty, or hold the farther target for the ratio.
And that is a BUY trade set up at the Low with Fibonacci; selling at the High works the same way.
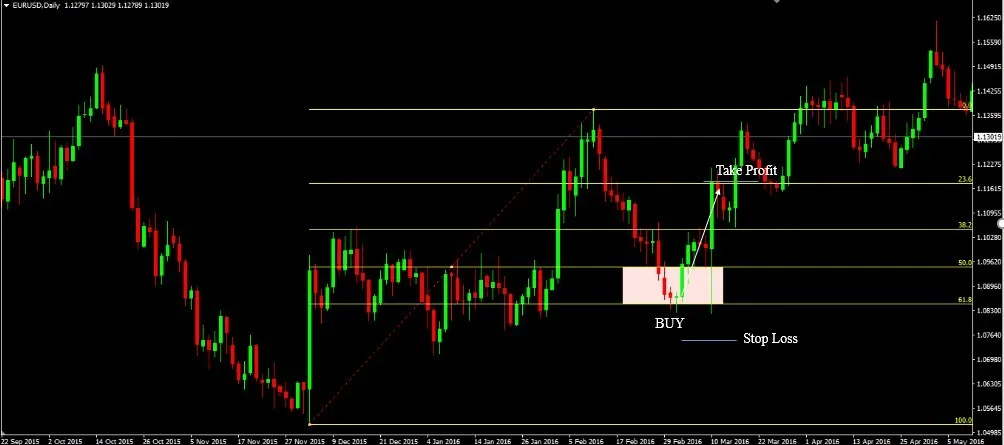
I hope this article has given you an easy picture of a trading system that buys lows and sells highs, and that you can then practice and test it on a demo account. Remember that high and low areas are only places where price may reverse, not places where it certainly will; always place a stop loss.
And do not forget to follow the news on the economic calendar, so that you know about any unusual volatility on the pair you are trading.