On this page
In foreign exchange trading, as in stocks, there are two schools of analysis that are more common than any other: technical analysis and fundamental analysis.
The two schools approach the market differently, which has caused no small amount of argument in the past: followers of fundamental analysis make light of charts, while followers of technical analysis hold that there is no need to pay attention to the news. If you understand the strengths and weaknesses of each method, though, you can perfectly well combine them for a fuller view while you trade.
What is technical analysis?
Technical analysis is a method of studying past price movement on the chart (price, volume, patterns, indicators) to judge where price is likely to go, without digging into the economic reasons behind it. The method rests on three main assumptions that come from Dow theory:
- Price discounts everything: all known information and all of the market’s expectations are expressed in the price.
- Price moves in trends: a trend that has formed is usually more likely to continue than to reverse.
- History tends to repeat itself: crowd psychology (greed, fear) changes little, so price patterns such as double tops, double bottoms and head and shoulders keep appearing.
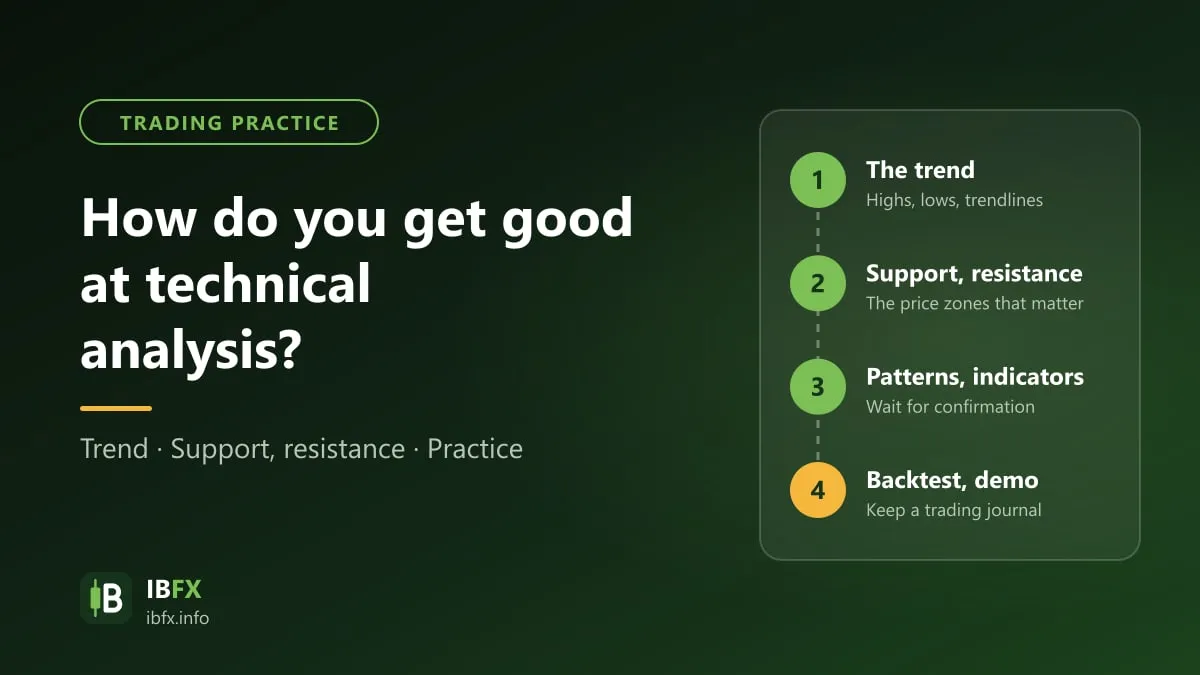
Common tools include support and resistance, trendlines, candlestick patterns, price patterns and technical indicators such as MA, RSI and MACD, all available in software like MT4 or TradingView. Technical analysis can be used on every timeframe, from a few minutes up to the weekly and monthly charts.
The weakness of technical analysis is that it is subjective: on the same chart, two traders may draw different support and resistance levels and choose different entry points and stop losses. Patterns and signals only tell you about probability; they are no assurance that price will move as forecast, and they can fail when unexpected news arrives.
What is fundamental analysis?
Fundamental analysis is a method of assessing the economic and political factors that affect the value of a currency or an asset. With stocks, the fundamental analyst looks at a company’s financial statements; with forex, the most important factors are:
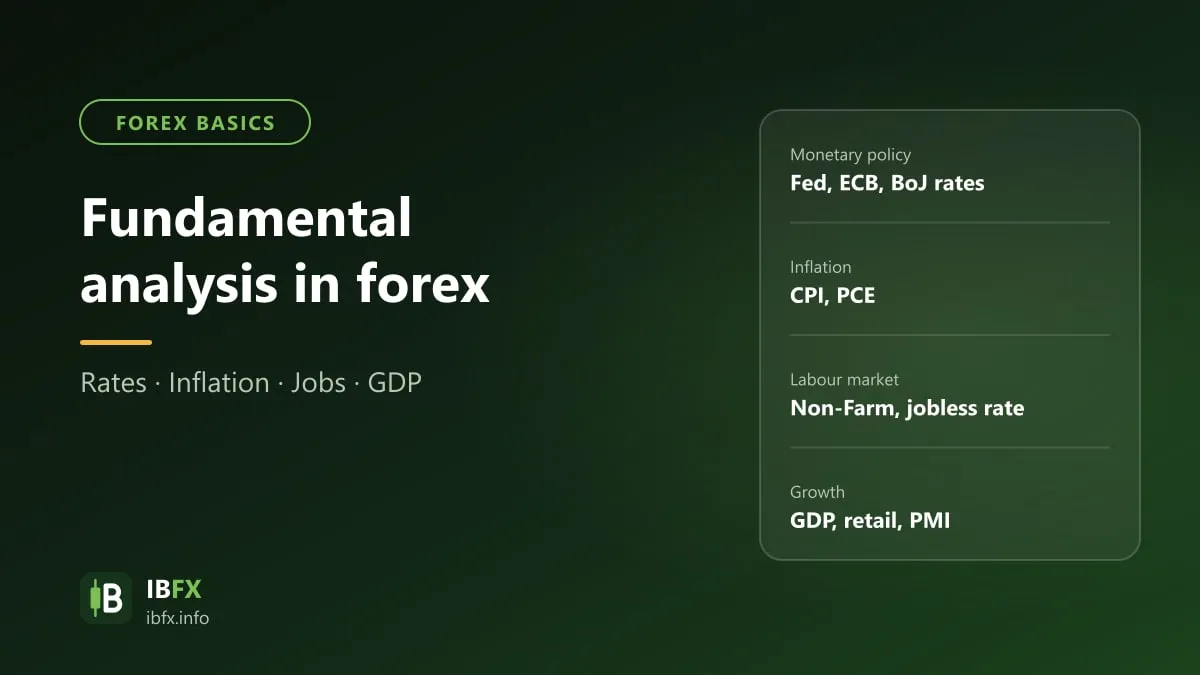
- Interest rates and the monetary policy of central banks such as the Fed, the ECB and the BoJ.
- Inflation (the CPI), economic growth (GDP) and the labor market (Non-Farm payrolls, the unemployment rate).
- The trade balance and investment capital flows.
- The political and geopolitical situation and the market’s risk appetite.
Fundamental analysis rests on the assumption that over the long run an exchange rate reflects the health of an economy and the interest rate gap between two countries; if price drifts away from a reasonable level, sooner or later it gets corrected. That gap, however, can last a very long time. The weakness of fundamental analysis is that it is hard to pin down a specific moment to enter, and price has usually already reflected expectations before the news is released, so “good” news does not necessarily push price up. See also: The factors that move foreign exchange rates
Technical analysis and fundamental analysis compared
- The data used: technical analysis uses the price chart; fundamental analysis uses economic figures, interest rates and news.
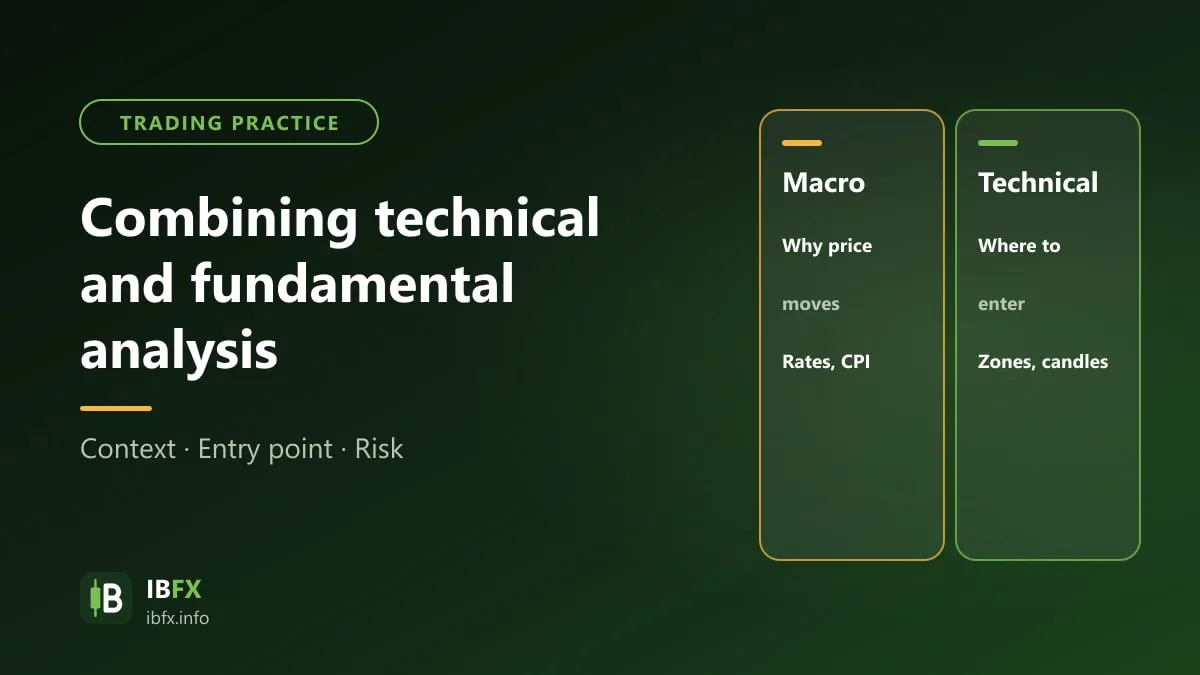
- The question answered: fundamental analysis answers “why might price rise or fall”; technical analysis answers “where should I enter, where should I put the stop loss”.
- Timeframe: fundamental analysis usually suits a medium and long-term view; technical analysis can be used on every timeframe, which is why scalpers favor it.
How to combine technical and fundamental analysis
Because each method answers a different question, the common way to combine them is:
- Use fundamental analysis to set the context and the preferred direction. For example, if the Fed is holding interest rates high while the ECB is leaning toward cutting, the USD has the advantage over the EUR, so you may prefer to look for opportunities to sell EUR/USD rather than to buy.
- Use technical analysis to choose the moment to enter and where to place the stop loss. Carrying on with the example above, instead of selling straight away, you wait for price to come back up into an important resistance zone and for a reversal candlestick signal to appear, and only then enter the sell, with the stop loss above that resistance zone.
- Use an economic calendar to manage risk. Avoid opening a position right before high-impact news; if the news comes out against your scenario and price hits the stop loss, respect the stop loss instead of holding on to the position because you believe “the fundamentals are still right”.
- When the two methods conflict, for instance when the fundamentals favor the USD but the EUR/USD chart is rising hard, cut your position size or stand aside and wait for a clearer signal.
There is no formula for combining them that is right in every situation; you need to be flexible according to market conditions and your own trading style. Whichever method you use, every trade still needs a stop loss and a sensible position size (usually risking around 1-2% of the account per trade), and it is worth practicing on a demo account first. See also: What to watch out for when you trade forex on the news