Fibonacci analysis is a classic tool in technical analysis, used by traders at every level, from individual traders to automated trading systems. The Fibonacci levels also turn up regularly in the technical analysis reports of investment banks. It is a simple tool and easy to learn, but like every other tool it does not give certain signals.
What is Fibonacci?
The sequence is named after Leonardo Fibonacci, the Italian mathematician (about 1170–1250) who introduced it to Europe in his book Liber Abaci in 1202; before that the sequence was already known to Indian mathematicians.

The Fibonacci ratios turn up in many shapes in nature.
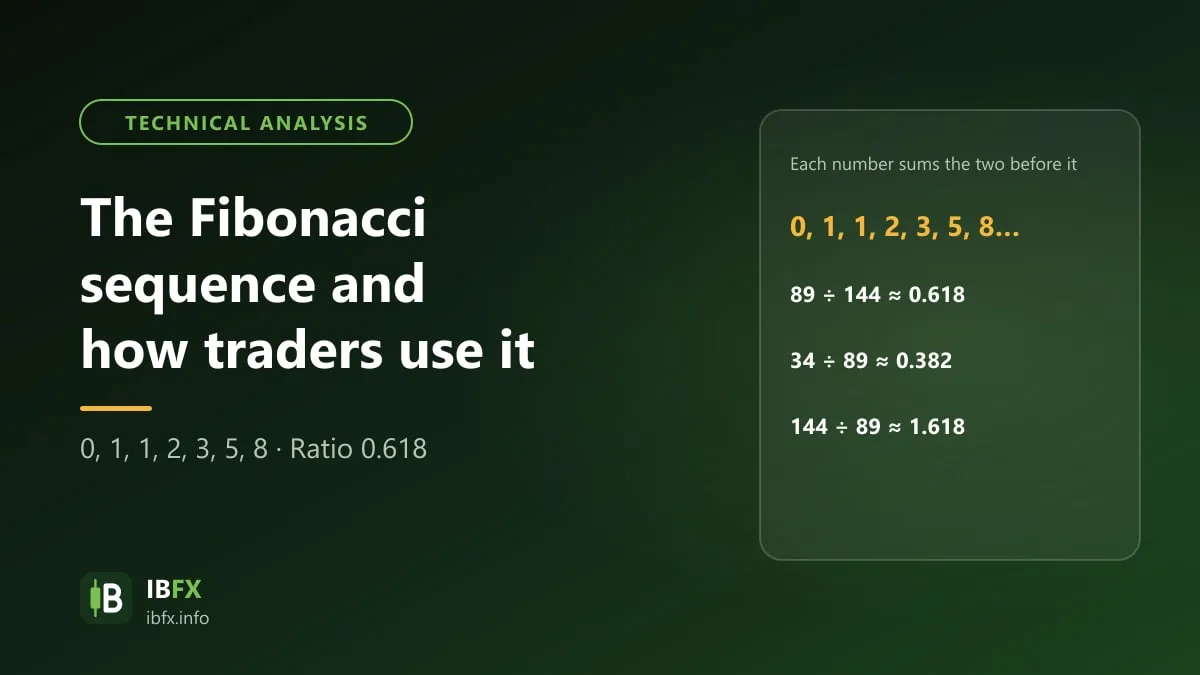
This is a simple string of numbers, but one connected to the golden ratio, which turns up in many shapes in nature. The sequence starts with the numbers 0, 1, 1, 2, 3, 5, 8, 13, 21, 34, 55, 89, 144… The rule of this sequence is that it begins with the two numbers 0 and 1, and each number after that is the sum of the 2 numbers right before it. For instance 1 = 0 + 1, 2 = 1 + 1, 3 = 2 + 1, 5 = 3 + 2, 8 = 5 + 3… Or 0, 1, 1, 2, 3, 5, 8, 13, 21, 34, 55, 89, 144, 233, 377, and the next number is 610…
If you look closely, in the Fibonacci sequence, taking any number and dividing it by the number right after it gives a result that gets closer and closer to 0.618 as the numbers get larger. For instance: 34/55 ≈ 0.618, 55/89 ≈ 0.618… Taking a number and dividing it by the number two places after it gives a result that gets closer to 0.382. For instance: 34/89 ≈ 0.382, or 55/144 ≈ 0.382…
And more important still: 1 – 0.618 = 0.382. These ratios are tied to the golden ratio (about 1.618, whose reciprocal is 0.618) and are the foundation of the Fibonacci levels used in trading. Read more: what the Fibonacci sequence is.
The Fibonacci levels
In trading, the 2 kinds of Fibonacci used most are the Fibonacci retracement and the Fibonacci extension:
- The Fibonacci retracement levels commonly used are 23.6%, 38.2%, 50%, 61.8% and 78.6% (some platforms use 76.4%). The 50% level is not a Fibonacci ratio, but most traders watch it.
- The Fibonacci extension levels commonly used are 127.2%, 161.8%, 200% and 261.8%.
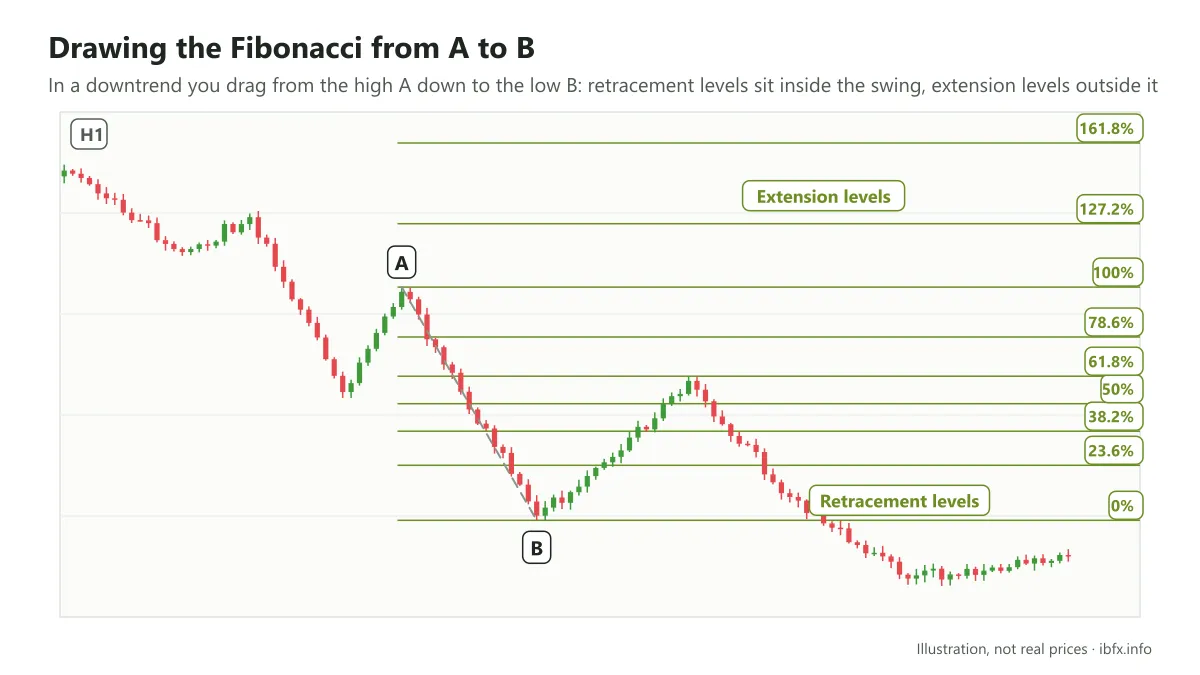
The Fibonacci levels are widely used.
These tools are already built into MT4 and most other trading platforms, so all we have to do is draw them on the chart; there is nothing to work out by hand.
Trading with Fibonacci
The Fibonacci tool comes in several forms (retracement, extension, fan, arcs, time zones), but in practice we usually only use two of them: the Fibonacci retracement and the Fibonacci extension.
Whether you are a professional investor or new to the job, treat the Fibonacci levels as potential support and resistance zones where price may react, not as points where price is certain to reverse.
The Fibonacci retracement is usually used to find an entry point, while the Fibonacci extension is usually used to work out take profit targets.
The Fibonacci retracement
The Fibonacci retracement is the one used most widely. You draw it by joining the low and the high of one clear price swing: in an uptrend you drag from the swing low up to the swing high, in a downtrend from the swing high down to the swing low.
In MT4, the tool draws 9 horizontal lines by default, at the 0.0%, 23.6%, 38.2%, 50%, 61.8%, 100%, 161.8%, 261.8% and 423.6% levels of the height of the swing; you can add the 78.6% level in the settings of the tool.
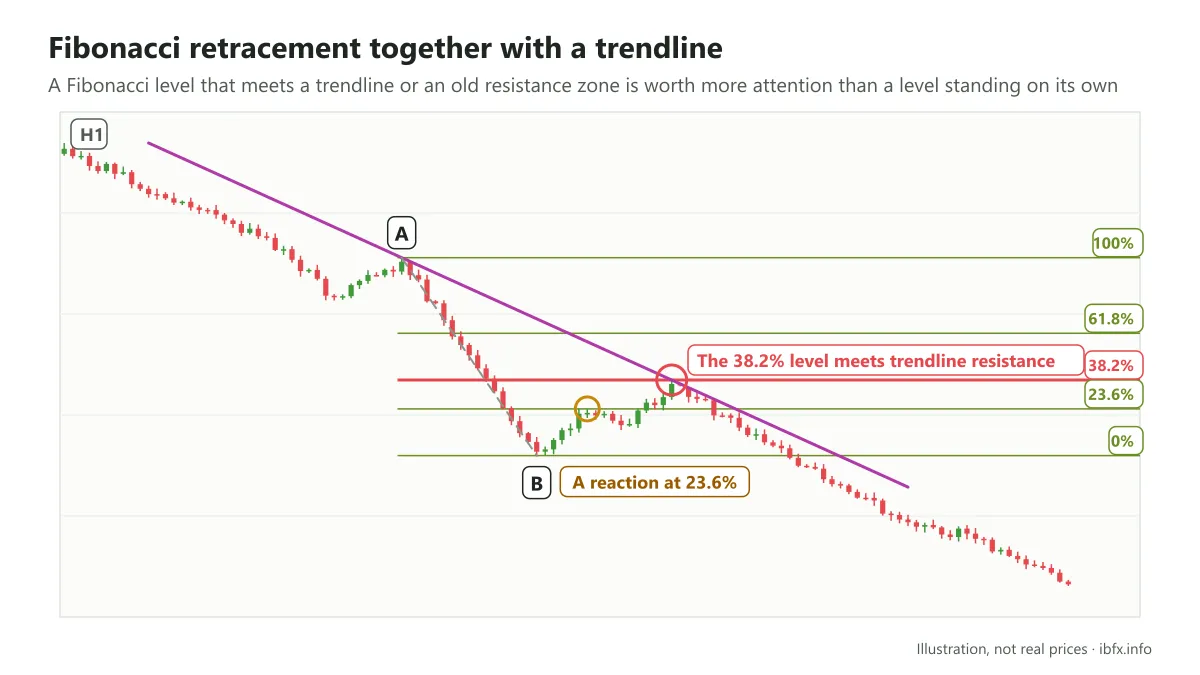
Trading with the Fibonacci retracement.
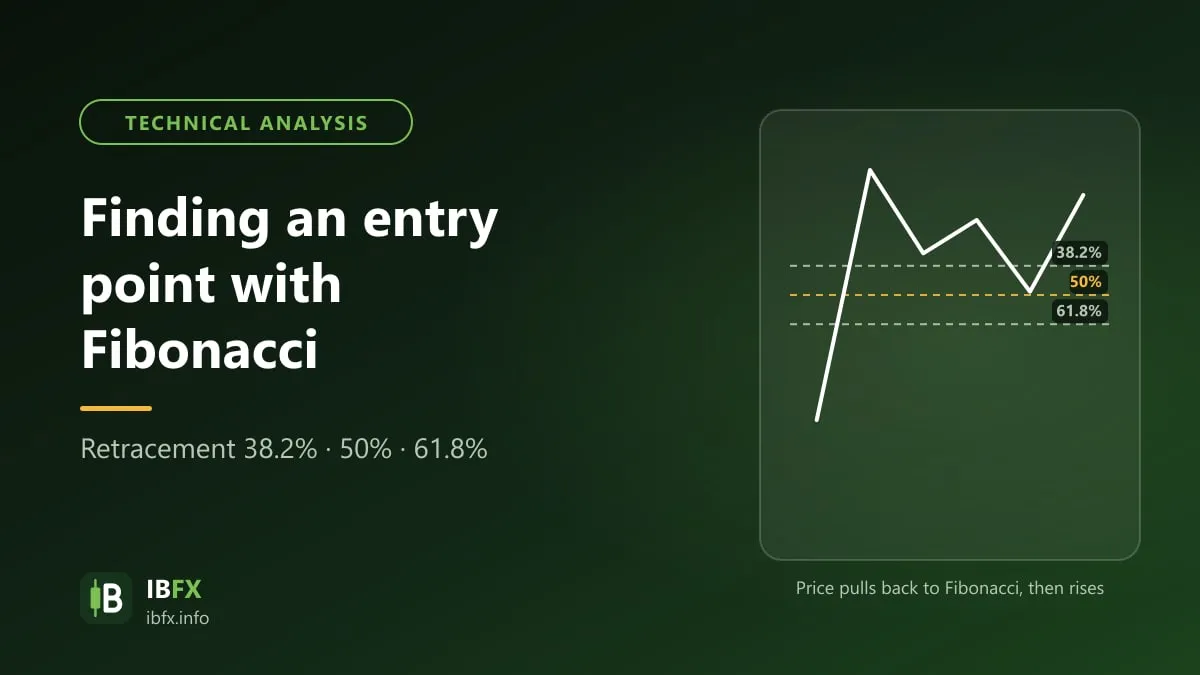
After every strong price move, up or down, price usually corrects part of the way back before it goes on. The Fibonacci retracement levels help you estimate where this correction may stop.
While price corrects, the new support or resistance zones usually sit on or near these Fibonacci lines. In the example chart above, price reacted at the Fibonacci 23.6% and 38.2% lines.
To make these levels more reliable, you should combine them with other tools, for example a Fibonacci level that meets an old support or resistance zone, a trendline or a moving average.
The steps for finding an entry point with the Fibonacci retracement
Here is an example in an uptrend (in a downtrend you do the opposite):
- Identify a clear uptrend and a rising swing that has just finished.
- Draw the Fibonacci retracement from the low up to the high of that swing.
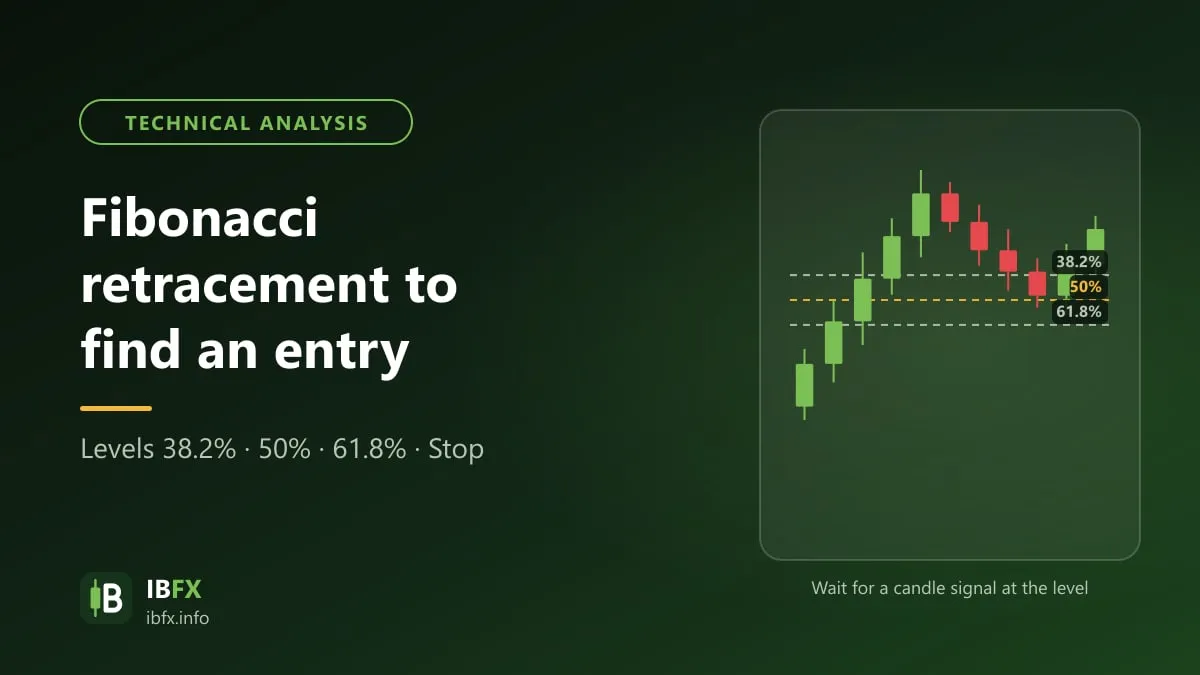
- Wait for price to correct back into the 38.2% – 61.8% zone, ideally where that zone meets an old support.
- Wait for a signal confirming that price is bouncing, such as a Pin Bar or a bullish engulfing candle, before you enter the Buy.
- Place the stop loss below the 78.6% level or below the swing low; if price cuts through the swing low, the scenario was wrong.
- Take profit at the old high or at the Fibonacci extension levels 127.2% and 161.8%.
Price does not stop right at the Fibonacci levels every time. Work out your position size from the stop loss distance so that each trade only risks a small part of the account, and practice on a demo account first. For a more detailed guide, see: how to use the Fibonacci retracement to find an entry point.
The Fibonacci extension
The Fibonacci extension also measures a price swing, but it is mainly used to project take profit targets once price moves outside the old range.
The difference is that the Fibonacci retracement finds levels inside the price swing that has already happened, while the Fibonacci extension projects levels outside that swing, where price has never traded.
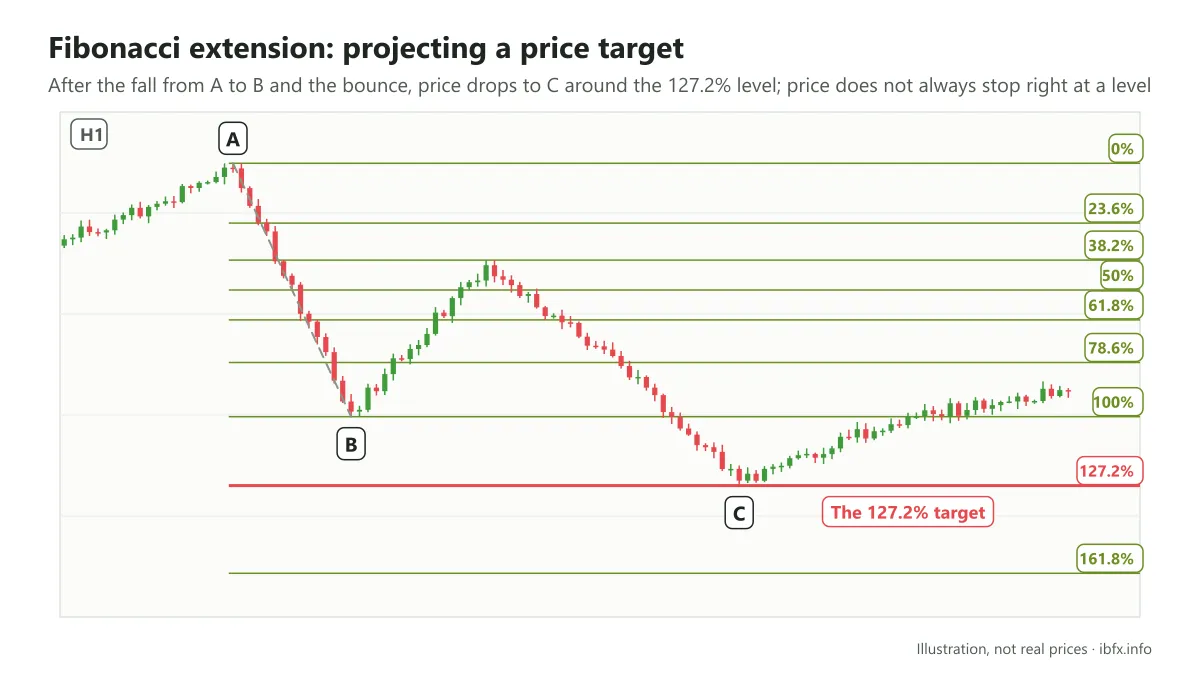
Trading with the Fibonacci extension.
The main Fibonacci extension levels are 127.2%, 161.8%, 200% and 261.8%, and they are usually used as take profit targets to work from. Read more: how to use the Fibonacci extension to take profit.