On this page
To trade with a plan you need to know how to read a chart, but looking at a single timeframe makes it very easy to “miss the forest for the trees”. Multiple timeframe analysis is a common approach that lets you observe the market from the big picture down to the detail before you decide to enter. See also: What is a timeframe?
What is multiple timeframe analysis?
Multiple timeframe analysis means looking at the same currency pair on several different timeframes, usually three, each of them with a role of its own:
- The higher timeframe (the trend timeframe): identifies the main trend and the important support and resistance zones.
- The middle timeframe (the trading timeframe): finds the corrective moves against the main trend, where you can prepare to enter.
- The lower timeframe (the entry timeframe): picks the moment to enter and places the stop loss in detail.
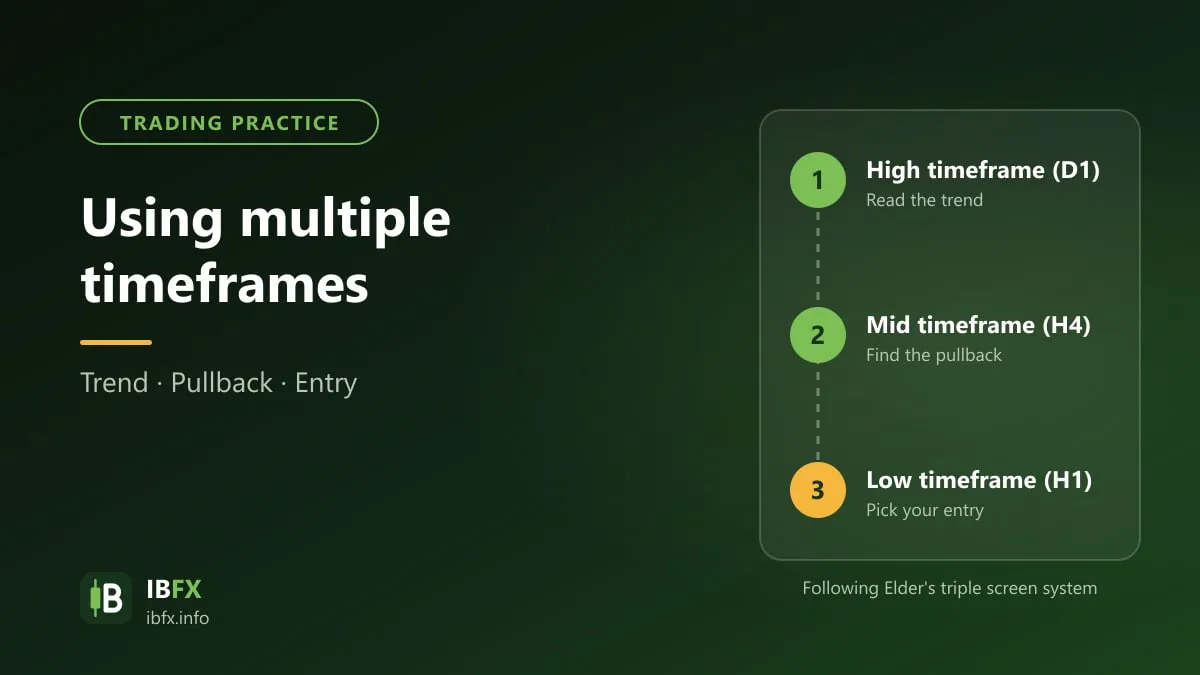
One of the best known multiple timeframe systems is the Triple Screen system introduced by Dr. Alexander Elder in the mid-1980s. According to Elder, each timeframe should be about 5 times larger than the next one down (weekly - daily - H4, for example, or H4 - H1 - M15):
- The first screen: on the higher timeframe, identify the trend (Elder uses the slope of the MACD Histogram or of an EMA). You trade only in that direction: in an uptrend look only for buys, in a downtrend look only for sells.
- The second screen: on the middle timeframe, use an oscillator (Stochastic, RSI or Williams %R, for instance) to find the corrective move against the main trend. In an uptrend, wait for the indicator to come down into the oversold zone; in a downtrend, wait for it to rise into the overbought zone.
- The third screen: choose the entry point. Elder uses a trailing pending order technique: in an uptrend, place a Buy Stop a little above the high of the previous candle; if price keeps falling and the order has not been filled, lower the pending order to just above the high of the newest candle, until the order is filled or the signals on the two screens above are gone. The stop loss goes below the most recent low.
Take RSI as an example: in a downtrend on the higher timeframe, when RSI on the middle timeframe rises into the overbought zone and then turns back down out of it, that can be a sell signal with the trend; the other way round, in an uptrend, when RSI comes back up out of the oversold zone, that can be a buy signal. See also: What is RSI?
The main purpose of this method is to join a trend that is already clear at a more reasonable price: after the corrective move against the trend shows signs of ending and price starts to turn back in the direction of the main trend, rather than chasing the buy or the sell. See also: What is a pullback?
Choosing your set of three timeframes to suit your trading style
The timeframe you mainly trade decides the other two. Some common choices:
- Long-term trading: the trend timeframe is monthly or weekly, the trading timeframe is daily, the entry timeframe is H4.
- Medium-term (swing) trading: the trend timeframe is daily, the trading timeframe is H4, the entry timeframe is H1.
- Intraday trading: the trend timeframe is H4, the trading timeframe is H1, the entry timeframe is M15.
The general rule: if the trend timeframe has no clear trend (it is moving sideways), keep trading with this method to a minimum; if the trend timeframe is rising, favor buys; if it is falling, favor sells.
Why does multiple timeframe analysis matter?
Many traders fix their eyes on one timeframe only: the long-term trader looks at the daily and weekly charts alone, while the scalper looks at M5 and M15 alone. That narrows the view, because an uptrend on a lower timeframe may be no more than a bounce within a downtrend on the higher timeframe. If you buy on the lower timeframe without knowing that price is sitting right below a major resistance zone on the daily chart, it is easy to buy just as price is about to turn around.
Multiple timeframe analysis helps you identify the overall trend and the important support and resistance zones, and from there to choose your entry, your stop loss and your take profit on a sounder basis. It is no assurance of a higher win rate, though; how well it works in practice depends on each person’s method and discipline.
Tools that support multiple timeframe analysis
The simplest way to identify the trend on the higher timeframe is to watch the structure of the highs and lows and draw a trendline, combined with support and resistance zones.
An uptrend has higher lows, with the trendline joining those lows; a downtrend has lower highs, with the trendline joining those highs. If you want something more objective, you can use moving averages: when the short-term average is above the long-term average and price is above both, the market can be treated as being in an uptrend; when the short-term average is below the long-term average and price is below both, the market can be treated as being in a downtrend.
On the trading timeframe, oscillators help you recognize overbought and oversold zones and the momentum of price. There are a great many options, such as RSI, Stochastic, CCI, Williams %R, or MACD (which is really a trend and momentum indicator); you should pick only one or two indicators you are familiar with rather than use too many.
What to watch out for when you use multiple timeframes
- Do not use too many timeframes: three is enough; looking at too many easily leaves you confused, forever seeing conflicting signals and never daring to make a decision.
- When the timeframes conflict, stand aside or cut your position size, instead of hunting for a reason to enter.
- Always place the stop loss according to the price structure of the entry timeframe and work out a position size so that each trade risks only around 1-2% of the account.
- Test the method on past data and on a demo account before you use real money.
Once you are used to looking at several timeframes, you become more patient: while price has not reached the target zone you wait calmly; when price reaches the target zone and a signal appears you enter according to the plan; and when price hits the stop loss you exit decisively. That patience and discipline only comes when you trust your trading system, and that trust should be built out of a serious process of verification.