On this page
Working out support and resistance levels matters a great deal to traders, but it is not an easy job, and many investors do not give support and resistance the attention it deserves. No support or resistance level lasts forever, so understanding why they break matters just as much as drawing them.
What are support and resistance levels?
Support and resistance is one of the most widely used methods in technical analysis; the idea is easy to grasp but very hard to master in real trading.
The method works out the price levels at which, in the past, price reversed or at least slowed down, on the assumption that this price behavior can repeat itself in the future (one of the founding assumptions of technical analysis). There are a great many ways of working out these important price levels.
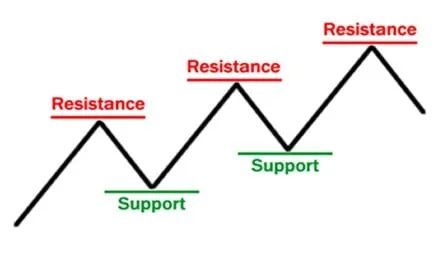
For instance you can work out support and resistance levels from a price channel, from highs and lows, or from the common price patterns. These levels often line up at the reversal points, at the price zones where price consolidated for a long time, or at the price zones most traders are watching. A level on a higher timeframe usually carries more meaning. Getting hold of these factors helps you plan your trades better, although it is no assurance that every trade wins.
What do support and resistance levels mean?
Working out the important support and resistance levels correctly is a foundation skill for a trader, and it takes plenty of time to learn and to practice.
These important price levels are usually where buying or selling money gathers. In practice these levels can swap roles (broken support becomes resistance and the other way round), and they are used to work out the range of the market and the points at which price may reverse, bounce or break.
Support and resistance in a trending market
In a market with a clear trend, rising or falling, price usually moves within a rising or a falling price channel.
The lower line of the price channel acts as support and the upper line acts as resistance; you can trade off these 2 support and resistance zones, giving priority to the direction of the trend. See also: What is a price channel?
Support and resistance in a sideways market
The other way round, in a market with no clear trend, price usually moves back and forth within a sideways zone.
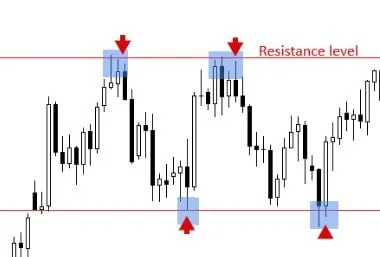
Support and resistance in a sideways market.
The upper edge of the sideways zone is resistance and the lower edge is support. When price rises into the resistance zone you can look for a Sell; when price falls back to the support zone you can look for a Buy, always with a stop loss on the far side of the price zone. If price closes right outside the zone, that is a break signal and you should not keep trading against it.
Keep in mind that support and resistance are not exact numbers but price zones, and that they can break. If you use a candlestick chart you will find it easier to recognize these zones.
In practice there are plenty of false breaks: the wick of a candle goes through the support or resistance level but price closes back inside, or price closes outside and then quickly comes back into the old zone.
What the important price lines are for
There are now many tools that draw support and resistance levels automatically, which saves investors a lot of work, but you should still understand how to work them out yourself. Support and resistance levels (or supply and demand zones) are the backbone of technical trading.
Whatever method of technical analysis is used, indicator-based or price-action-based, support and resistance levels play an important part.
The overbought and oversold signals of the indicators are usually worth more notice when they show up at support and resistance levels. The common rule is to buy near support and sell near resistance.
In some cases, though, price will run through the support or resistance level a short way to sweep traders’ stop losses before it comes back. If you place a pending order right at that price with the stop loss too close, the order can be filled and then hit the stop loss straight afterwards.
How do you know a support or resistance level is no longer strong?
First you have to understand that support and resistance levels are price zones where buying or selling pressure once overwhelmed the other side. That is why price usually reacts when it reaches these levels, though this is not always the case.
When these levels have weakened, price can break out through them easily. There are 2 common kinds of break:
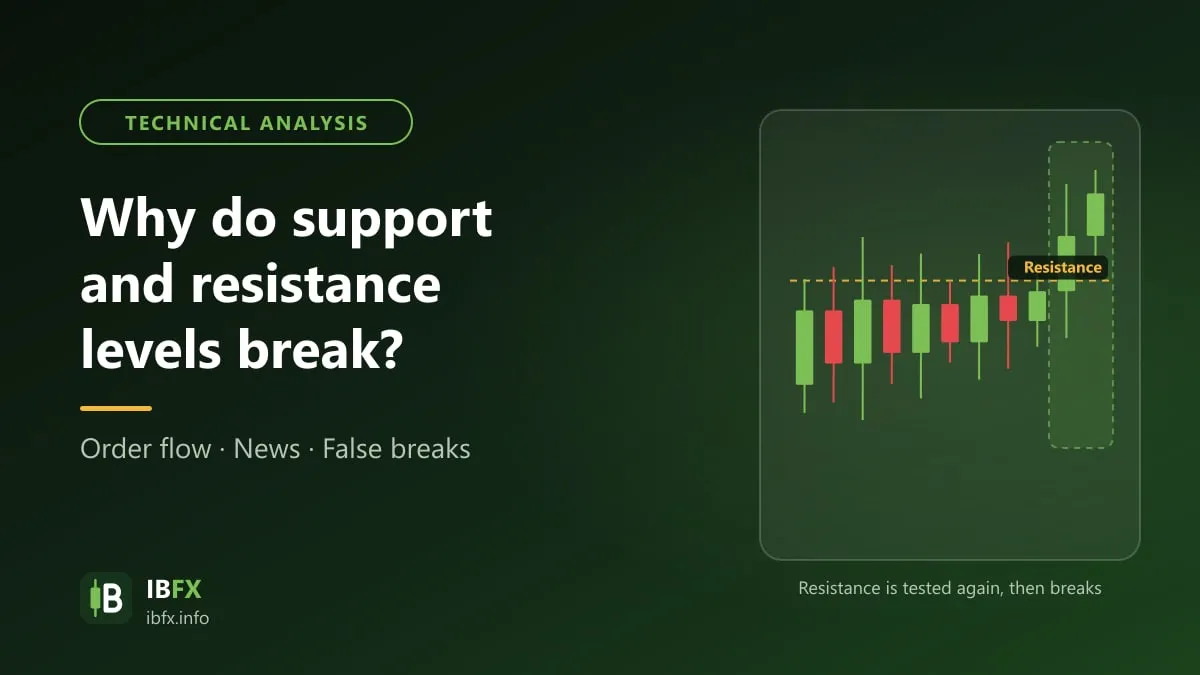
- Price breaks the support or resistance level with one strongly rising or falling candle.
- Price swings around the support or resistance level for a while, possibly making a false break, and only then makes the real break.
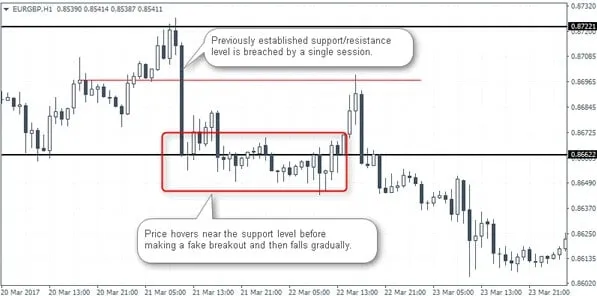
A support or resistance zone with too many candles running up and down through it is no longer safe.
The market price has usually already taken in the information everybody knows. When unexpected new information comes out, the market adjusts, which can produce a strongly rising or falling candle that breaks the nearest support and resistance levels.
When price moves sideways right alongside a support or resistance level and touches it many times, the pending orders sitting there are absorbed bit by bit, so the level usually grows weaker and weaker. Often a single economic release is enough for price to break that supply or demand zone.
New support and resistance levels against old ones
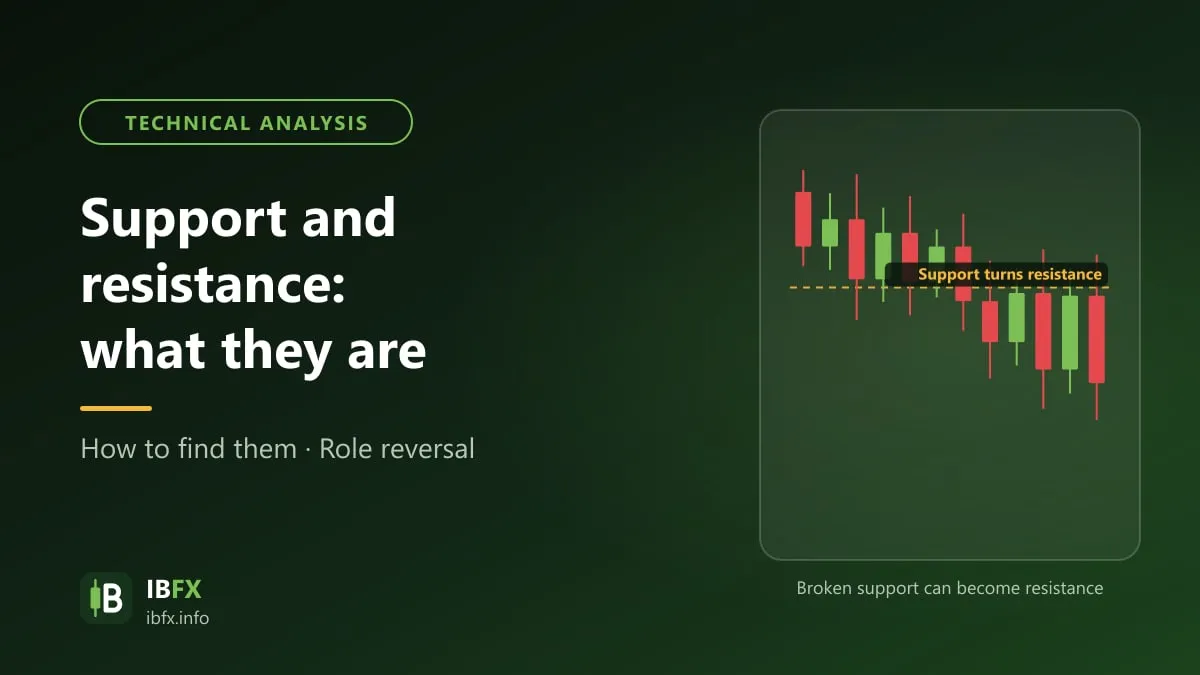
A trader should know that a support level, once broken, can turn into a resistance level, and the other way round. A support or resistance level usually carries the most meaning on its first test.
That is not always the case, though. The next example shows a newly formed support level breaking even so, although it had only been tested once.
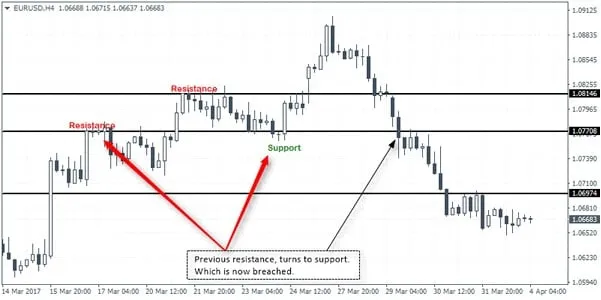
Support and resistance can swap roles with each other.
Support and resistance levels keep changing as price moves and as new information comes out. Once you have worked out a level, the best thing is to confirm it with other tools or with fundamental analysis, to judge how likely it is to hold or to break, and always to place a stop loss.
Alongside that, be careful at the moments when the forex market has strong news, by following the economic calendar on sites such as Forex Factory, investing.com and fxstreet.com.