On this page
Technical analysis is one of the most widely used methods of analysis on the forex market. Working from the chart, a trader follows the movement of price and weighs up the chances of price rising or falling in order to plan an entry, a stop loss and a take profit. No method forecasts price exactly, but if you have a firm grip on the foundations below and you practice seriously, you will read a chart better and trade to a plan. Read more: What is technical analysis?
What is a market trend and how do you identify one?
Price on the forex market never moves in a straight line; it always alternates between up and down. If price holds one main direction over a period of time, we say the market has a trend. A market trend is formed out of the psychology of the people taking part in the market and out of what they buy and sell.
By duration, trends are usually sorted into three levels: the long-term trend (months to years), the medium-term trend (weeks to months, usually the corrections inside the long-term trend) and the short-term trend (days to weeks). That way of sorting them comes from Dow theory. An uptrend on the daily chart may be no more than a pullback inside a downtrend on the weekly chart, which is why you always need to look at the trend on the higher timeframe.
By direction, the market has three states:
+ Uptrend: price makes higher highs and higher lows. In the stock market, a long-term uptrend (a bull market) usually goes together with rising investor confidence and expectations of a healthy economy, and it usually begins before the economy shows any clear sign of recovery.
+ Downtrend: price makes lower highs and lower lows. In the stock market, a long-term downtrend (a bear market) usually goes together with falling investor confidence, and it usually appears before the economy weakens visibly. In forex, a currency pair falling only means the base currency is getting weaker against the quote currency; it does not have to mean the economy is getting worse.
+ Sideways: the market has no clear trend, and the highs and the lows sit around the same price zone. A sideways stretch usually ends with a break that forms a new trend, but not every break is a strong one, and false breaks are fairly common. Read more: What is a sideways market?
To identify the trend, traders usually look at the structure of the highs and the lows, draw trendlines, use moving averages, and put that together with support and resistance levels. Read more: What is a trend? How to identify the market trend
The levels that matter: support and resistance
Support and resistance are price zones where supply and demand were once clearly out of balance, so price stalled or turned around there. When price comes back to these zones, it may slow down, bounce away, or break through and carry on. Read more: Support and resistance: what they are and how to identify them
- Resistance is a price zone above the current price, usually found from earlier highs, where selling pressure was once strong enough to push price down.
- Support is a price zone below the current price, usually found from earlier lows, where buying was once strong enough to push price up.
When price clearly breaks a support or a resistance zone, it often has extra momentum to carry on in the direction of the break (a breakout); false breaks are very common as well, though, where price goes through and then comes straight back. Once a level has been broken, old support can become new resistance and the other way round. That is why you should treat support and resistance as a price zone rather than one exact number.
How to use them at a basic level: you can consider opening a buy when price falls back to a support zone and there is a sign of a bounce, with the stop loss below the support zone; the other way round, consider a sell when price rises into a resistance zone and there is a sign of a rejection, with the stop loss above the resistance zone. Picking out the support and resistance zones that matter is a foundational skill, and it takes a lot of practice before you are good at it.
Chart patterns in technical analysis
On a chart you will keep running into two common families of chart patterns: reversal patterns and continuation patterns.
A reversal pattern is a sign that the current trend may be coming to an end, for example the head and shoulders pattern and the double top and double bottom.
Take the double top, which appears after an uptrend: price rises twice into the same resistance zone and fails both times. The pattern is only confirmed once price closes below the neckline (the low between the two highs); before that break, price can still go through and carry on rising.
A continuation pattern is a sign that the current trend may carry on after a pause, for example the flag, the triangle, the rectangle and so on. Note that no pattern is certain: a continuation pattern sometimes breaks the other way and turns into a reversal, and a reversal pattern can fail too. So wait for confirmation and always set a stop loss.
Technical indicators
A technical indicator is worked out from price (and volume), and it helps a trader identify the trend, overbought and oversold zones, the momentum of price or the level of volatility. There are a great many indicators, and picking the ones that suit your own method is not easy. Decide what you want first (identifying the trend, finding an entry, or measuring volatility) and only then choose the tool, rather than running so many indicators at once that the signals get in the way of each other.
Some common indicators: Moving Average, Bollinger Bands, RSI, MACD…
The trend indicators help you identify the trend over a period of time and usually sit on the price chart itself; the moving average is the most widely used trend indicator.
The oscillators help you identify overbought and oversold zones and the momentum of price. These indicators usually sit in their own window below the chart; the most common are the Stochastic, the RSI and the MACD. The volume indicators, meanwhile, tell you how busy trading is; note that in spot forex the volume on MT4 is only the number of times price changed (tick volume), not the real volume of the whole market.
An indicator is worked out from past prices, so it always lags, and overbought or oversold readings can last a very long time when the market is trending strongly.
A practice routine for getting good at technical analysis
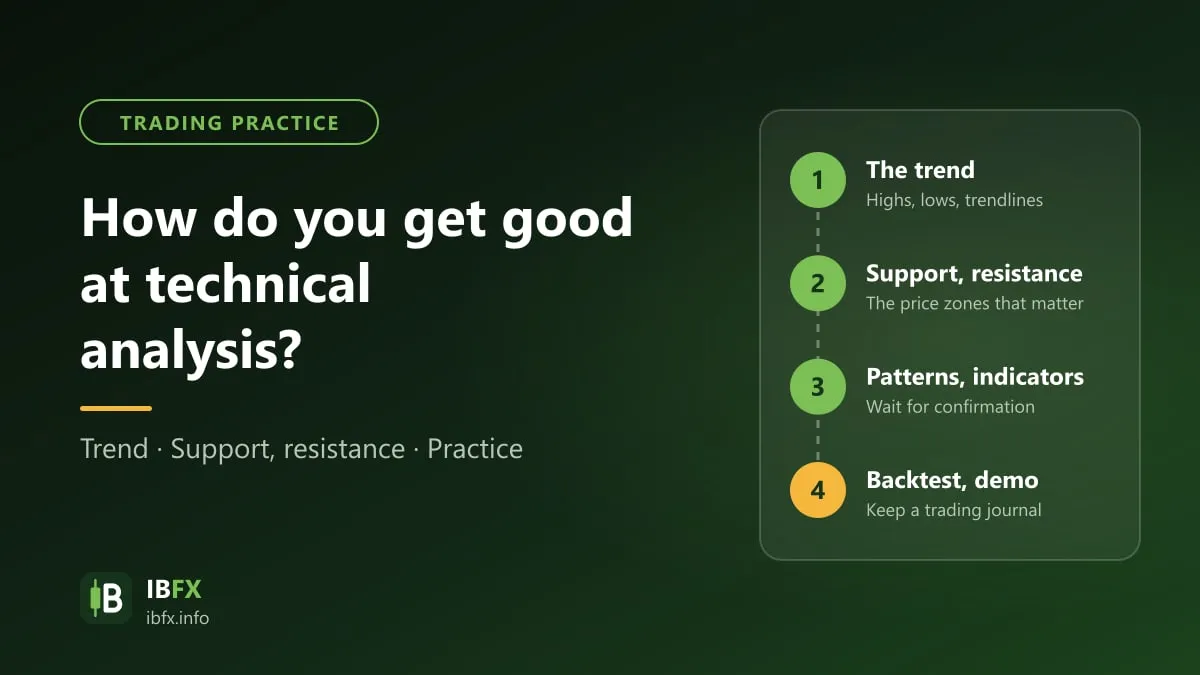
- Learn each foundational tool properly (trend, support and resistance, candlestick patterns) before you add indicators.
- Pick one simple method and write down its conditions for entry, stop loss and take profit.
- Test the method against past data (a backtest), then trade it on a demo account for long enough.
- Keep a trading journal so you learn from the losing trades as well as the winning ones.
- Manage your risk at all times: each trade should risk only about 1–2% of the account.
Technical analysis gives you more to go on when you weigh up what price may do, but no method forecasts exactly or produces a steady income; make sure your capital is safe before you think about profit.